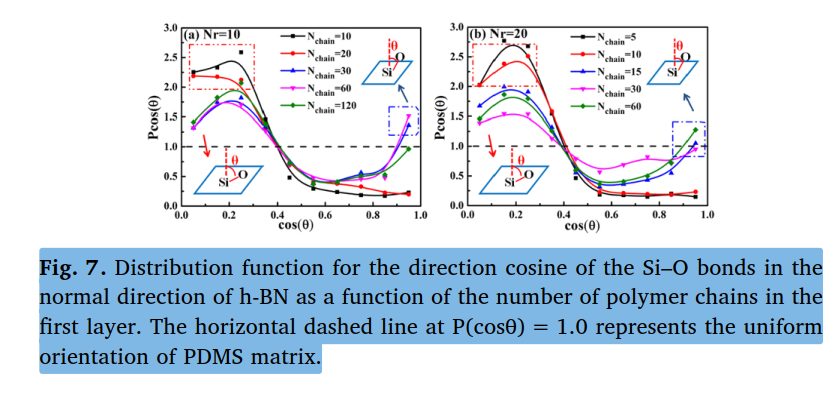
Hello LAMMPS user. I want to plot the alignment of the polymer on the filler surface similar to the figure shown. However, I am unsure which command would be suitable for this. I have already tried using “bond/local” but I was unable to obtain the exact data. If there is anyone, please guide me. Thank you so much.
You cannot expect that complex analysis can be done directly with LAMMPS. It is not a general script language like Python and not a plotting tool either.
Most of the analysis you are quoting is done by post-processing simulation data with custom scripts or programs, e.g. written in python, that are run after the simulation.
Noted, thank you so much, Dear @akohlmey. I will try to write a Python script, but I am not sure which LAMMPS code I used to get some initial data. I used the bond/local command, which provided me with the x, y, and z components. After postprocessing the components, I obtained the directional cosine. but not able to get pcos(theta) value.
Sorry, but this off-topic here, since it is not really a LAMMPS issue, but a question of your programming skills and understanding for spatial geometry. These are topics for discussion with your adviser or supervisor or collaborators or experienced colleagues, i.e. people that have a vested interest in your research.
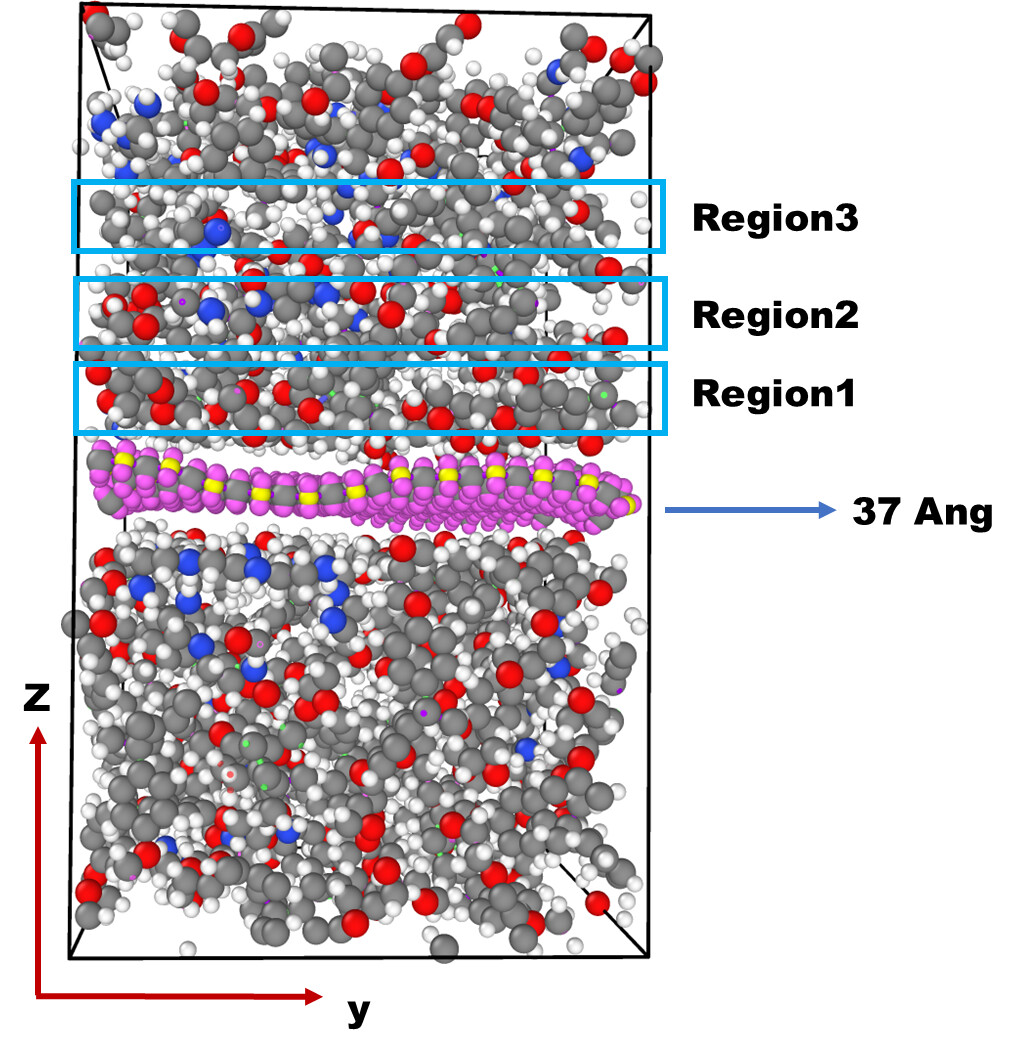
Dear @akohlmey, I have a question about the bond calculation. I am using Bond/Local for bond calculation and Local Dump for the output of the bond. I’m not sure if the dump outputs the bond in sequence or randomly. For example, in the following figure, are the atoms near the filler (region 1) printed first in the dump, and then region 2, or are the bonds distributed randomly?,Is it possible to output the randomly distributed bond in sequence
thank you so much