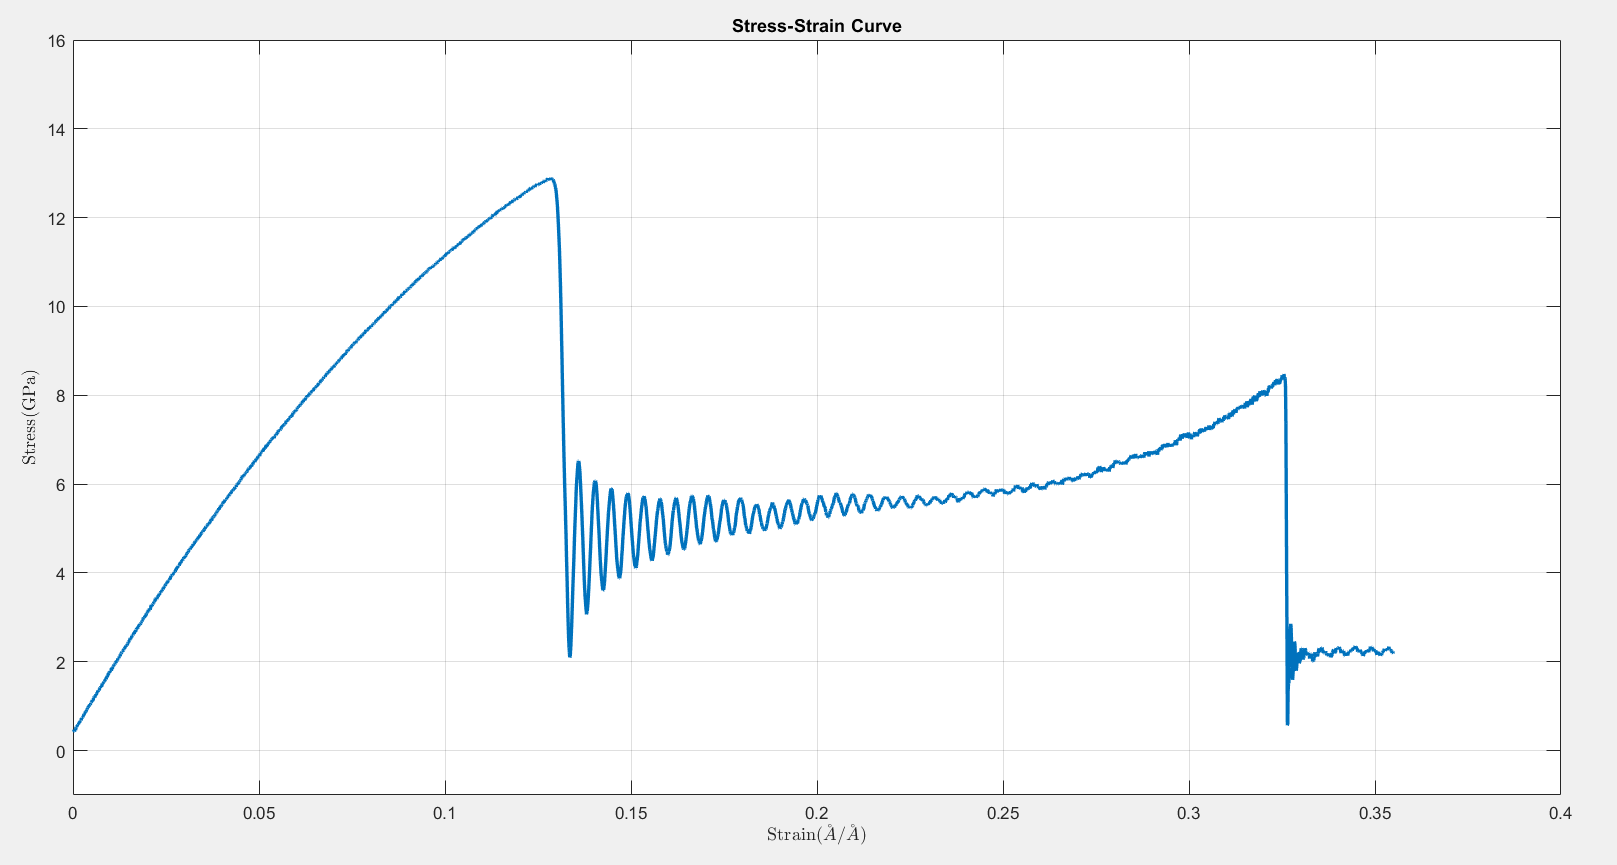
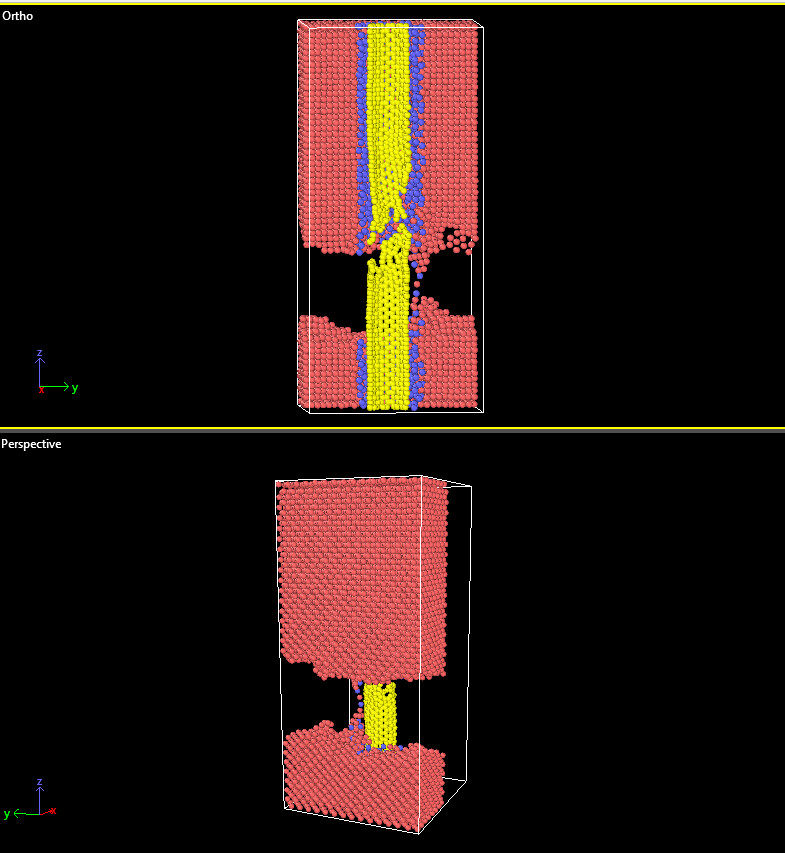
I’m currently performing MD simulation on a Titanium-coated SWCNT reinforced Aluminium MMC under uniaxial tensile loading. In the resulting stress-strain curve, I observe a typical elastic region followed by the peak UTS (~13 GPa). However, after the first major stress drop, the curve exhibits oscillatory behavior (stress fluctuations) before eventually stabilizing or undergoing a second failure event.
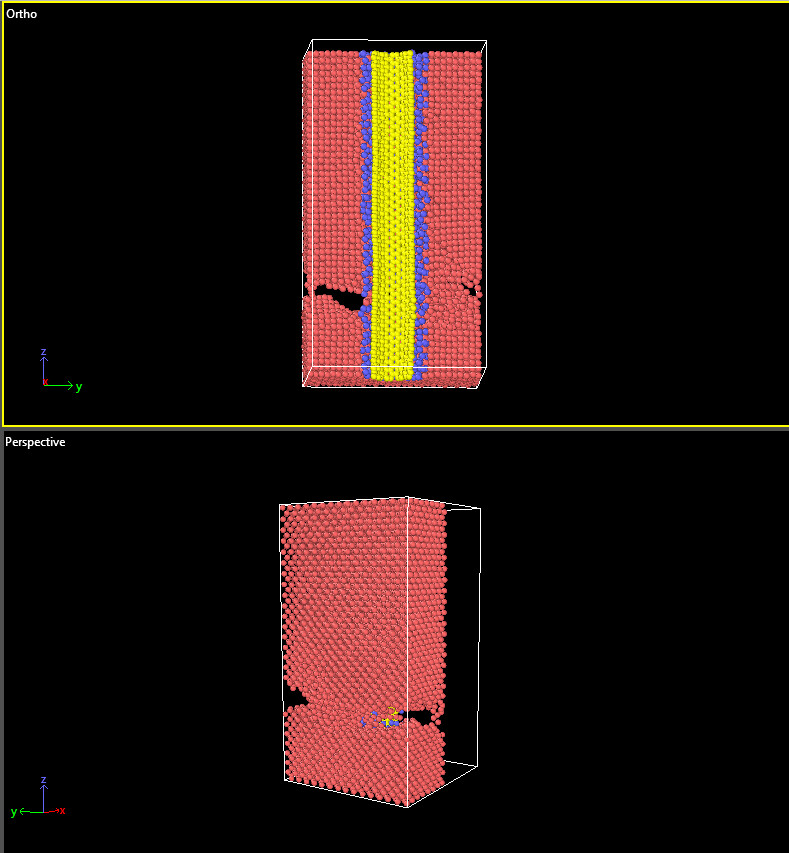
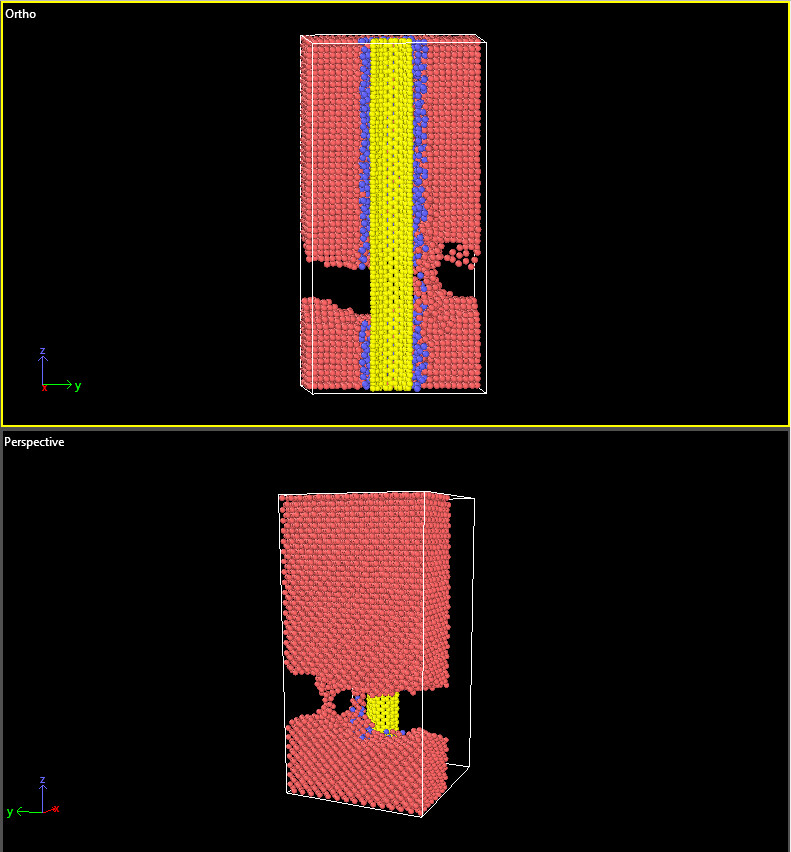
This snapshot is right after the first the peak or first failure. In this case, breakdown of Al matrix occurs but coated CNT remains intact and does the remaining load transfer.
The only way to answer the above question is to search the existing published literature on MD nanocomposite simulations.
To me it seems reasonable that an MD “nanostructure” with a well-defined elastic response would, in fact, behave as a good resonator with high Q factor (look it up, it’s standard oscillation physics). It is after all an object with a very symmetrical shape and having a highly regular lattice with artificially smooth interparticle interactions, with no external energy damping (such as an atmosphere) other than whatever thermostat you implemented.
Whether the model’s behaviour is relevant to the study of real world objects is not something I would know, not being an expert in this particular field.