Dears
I reviewed in some papers that g (r) not start zero but start at 1 or 2 in relation with r(A) as in figure below, my question is can we do that by ovito options or from lammps input scripts and is there any effects if the relation start at 1 or 2.
Dear peterschindler
Many thanks for clarification. many the below question is most clear which I posted in ovito category.
Dears
I reviewed in some papers that g (r) not start zero but start at 1 or 2 in relation with r(A) as in figure below, my question is can we do that by ovito options or from lammps input scripts and is there any effects if the relation start at 1 or 2.
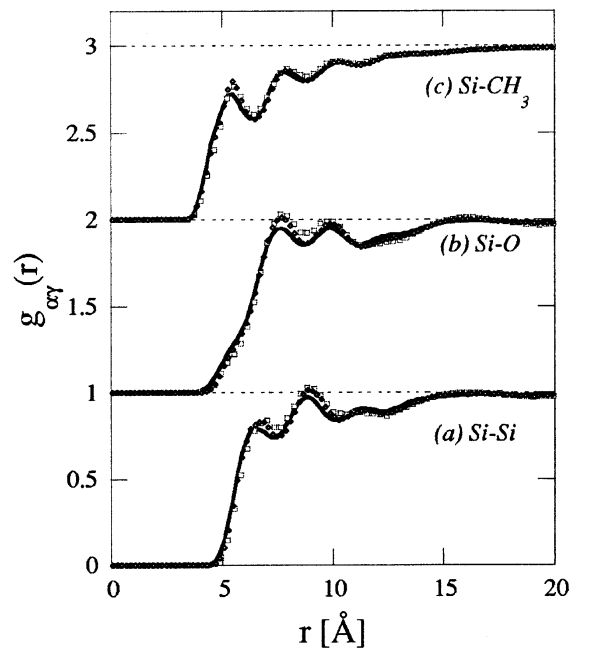
I’m not sure if this really your question, but I first want to point out that g(r) functions generally start at 0, never at some other value. That’s because g(r) measures the probability of finding two particles in the system separated by a distance r. Thus, g(r=0) must be equal to 0, because it’s impossible for two particles to have no separation at all.
The author of the figure you posted has artificially shifted the curves (b) and (c) by one and two units so that they do not overlap with each other and curve (a). That has been done just for the sake of clarity, because all three curves plotted on top of each other would be difficult to discern in a monochrome depiction.
In OVITO, all three partial g(r) functions start at 0 and are plotted on top of each other. You have to modify the underlying data values to shift the curves. This can be done in OVITO Pro with the help of a simple Python script modifier altering the DataTable object that stores the tabulated g(r) values. If you are a OVITO Basic user, you have to export the g(r) data table to a text file and use an external plotting tool to plot the three curves exactly in the way you want.