Dear Lammps users,
I explored the pair_style table on a very simple system to familiarize myself with that style but ran into some discrepancies I would appreciate help with. My system is made of 2 atoms. One is fixed, the other is being pushed away by a non-bonded harmonic potential that I defined using a table. My input script is as follows:
units si
dimension 2
boundary p p p
atom_style atomic
region box block -1 1 -1 1 -1 1
create_box 1 box
create_atoms 1 single 0.0 0.0 0.0 #Atom 1 fixed
create_atoms 1 single 1e-6 0.0 0.0 #Atom 2 at inner cutoff distance
mass 1 1.0
group atom2 id 2
pair_style table linear 10
pair_coeff 1 1 pot.tab HARM_TEST
pair_write 1 1 10 rsq 1e-6 1e-3 tabledebug.txt PAIR_DEBUG
atom_modify sort 0 0.0 # no sorting
fix push atom2 nve
dump coor atom2 custom 100 dump.coor.lammpstrj id x fx
timestep 2e-5
run 10000
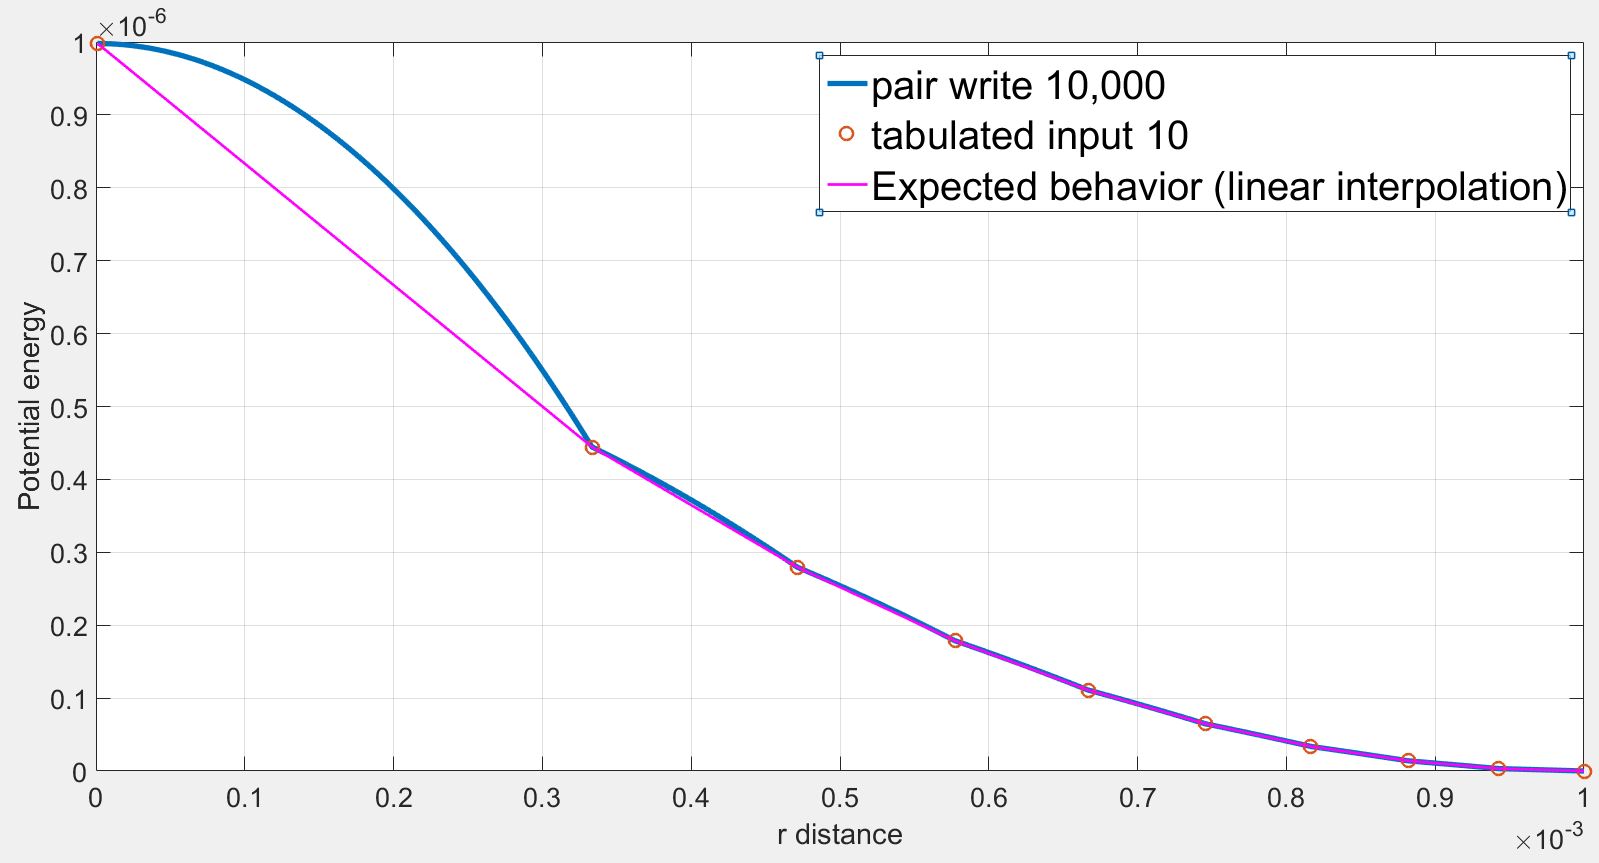
The pot.tab table file uses 10 points with RSQ spacing and harmonic parameters K=1.0, r0=1e-3 with inner and outer cutoff respectively 1e-6 and 1e-3. The table file is as follows:
LAMMPS test table file harmonic potential
HARM_TEST
N 10 RSQ 1.000000e-06 1.000000e-03
1 1.000000e-06 9.980010e-07 1.998000e-03
2 3.333347e-04 4.444427e-07 1.333331e-03
3 4.714053e-04 2.794123e-07 1.057189e-03
4 5.773508e-04 1.786323e-07 8.452983e-04
5 6.666671e-04 1.111108e-07 6.666658e-04
6 7.453563e-04 6.484342e-08 5.092874e-04
7 8.164968e-04 3.367343e-08 3.670064e-04
8 8.819172e-04 1.394354e-08 2.361655e-04
9 9.428091e-04 3.270799e-09 1.143818e-04
10 1.000000e-03 0.000000e+00 0.000000e+00
The file tabledebug.txt obtained by the pair_write command is identical to the pot.tab table file used as an input. The tabledebug.txt file is as follows:
PAIR_DEBUG
N 10 RSQ 1e-006 0.001
1 1e-006 9.98001e-007 0.001998
2 0.000333334666664 4.444427e-007 0.00133333100000011
3 0.000471405345748221 2.794123e-007 0.001057189
4 0.000577350846539606 1.786323e-007 0.0008452983
5 0.000666667083333203 1.111108e-007 0.0006666658
6 0.000745356290642267 6.484342e-008 0.0005092874
7 0.000816496785051846 3.367343e-008 0.0003670064
8 0.000881917229676346 1.394354e-008 0.0002361655
9 0.000942809100507627 3.27079900000001e-009 0.0001143818
10 0.001 0 0
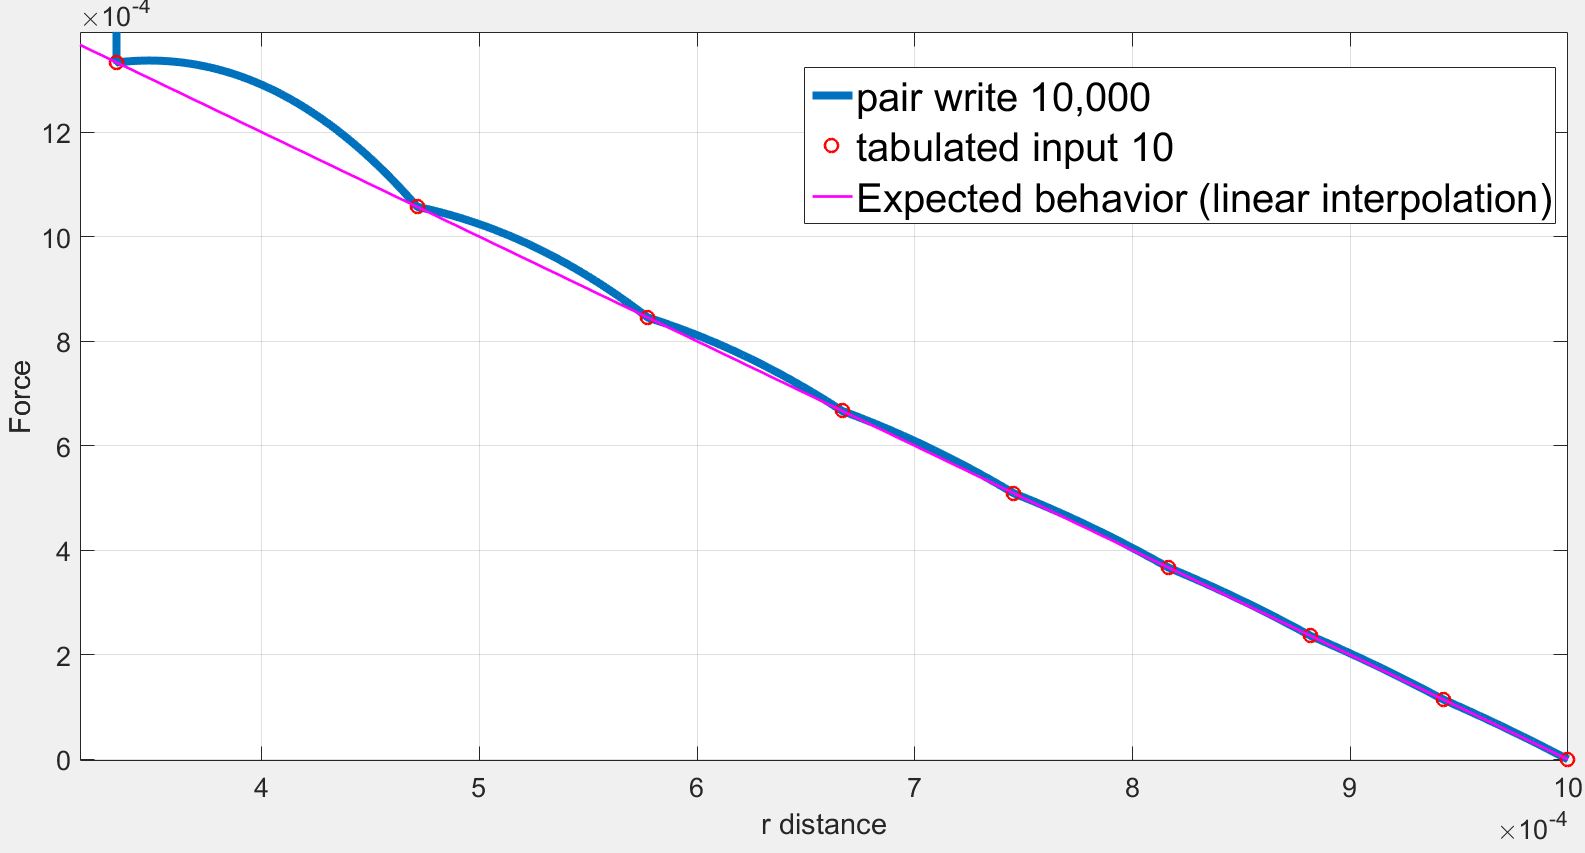
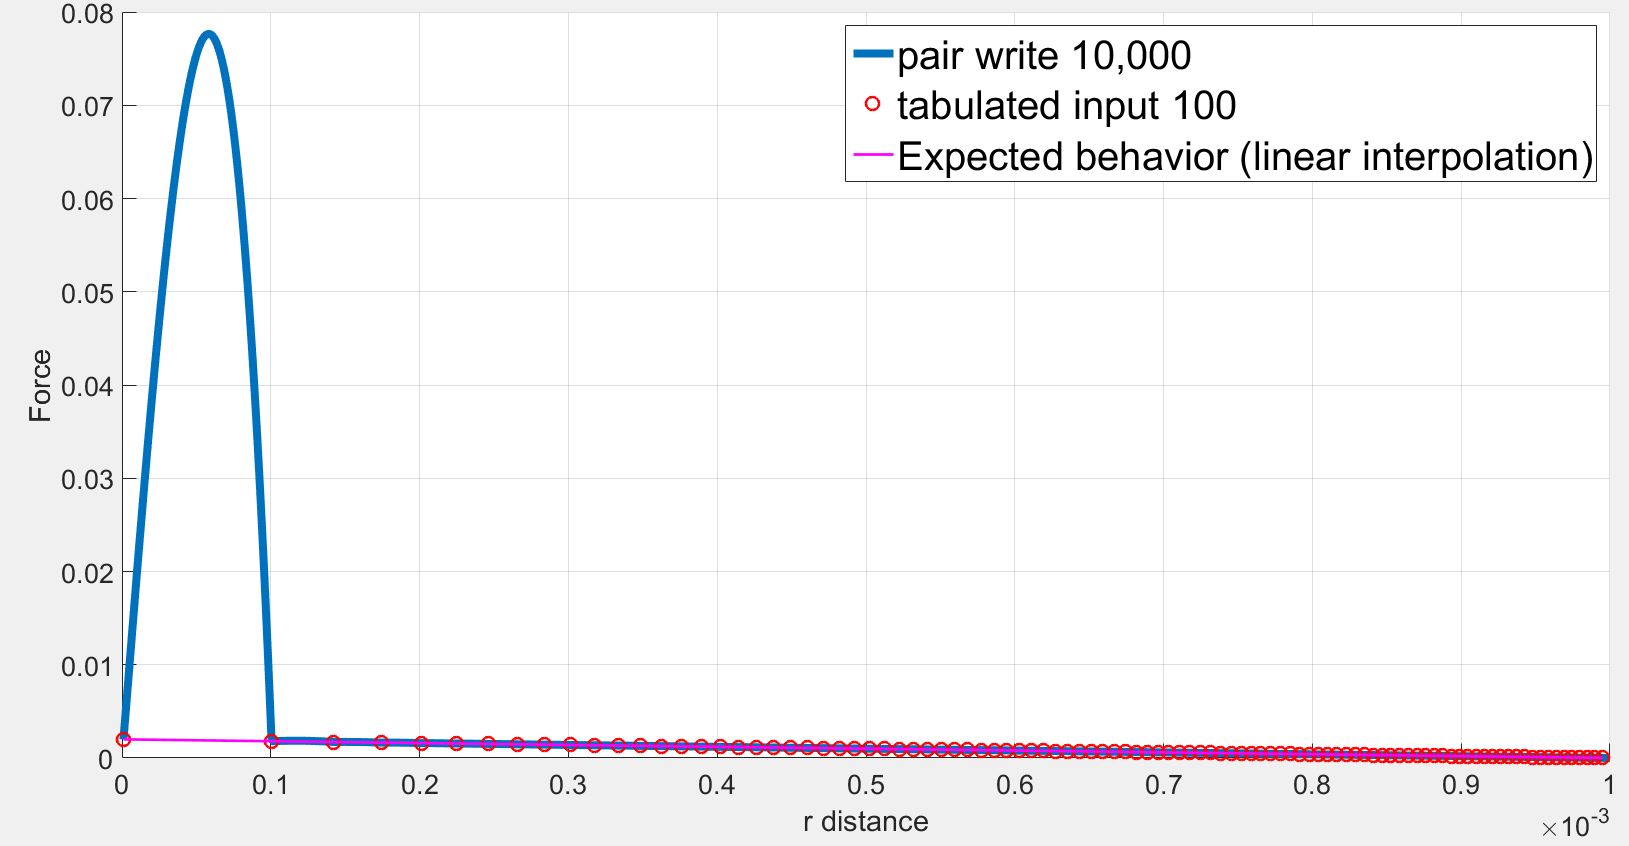
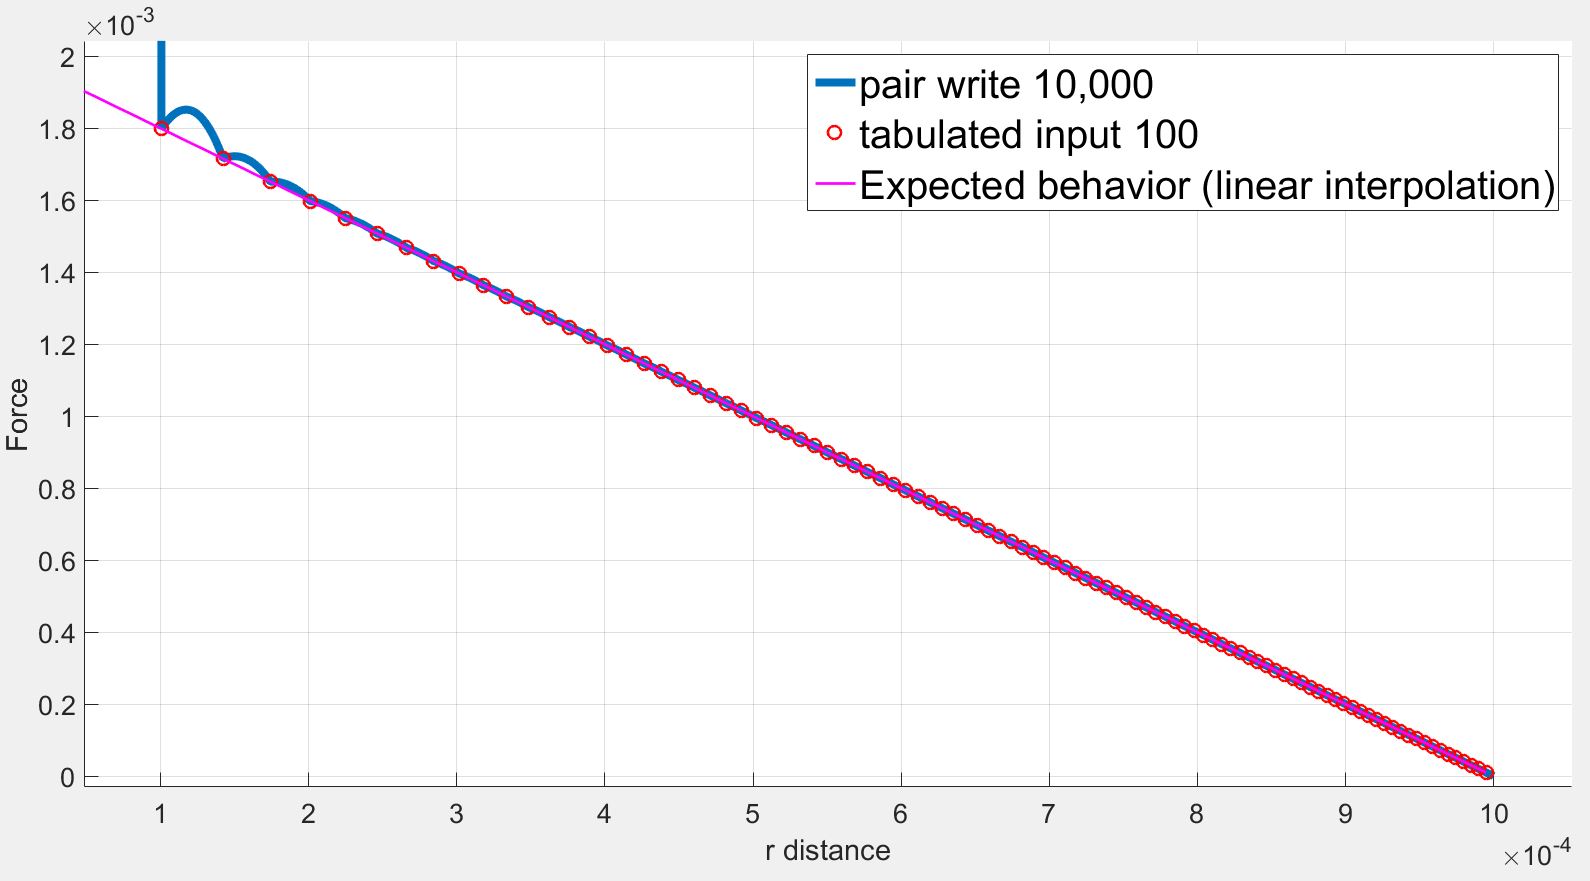
However, the position and the force on the atom2 obtained by the dump command are not consistent with the tabulated values. Especially, at low r, the force are highly overestimated. Selected lines of the dump file (first column = x, second column = fx) is as follows:
x fx
1.000000e-06 1.998000e-03
…
1.910920e-04 2.565790e-01
…
7.454560e-04 5.091220e-04
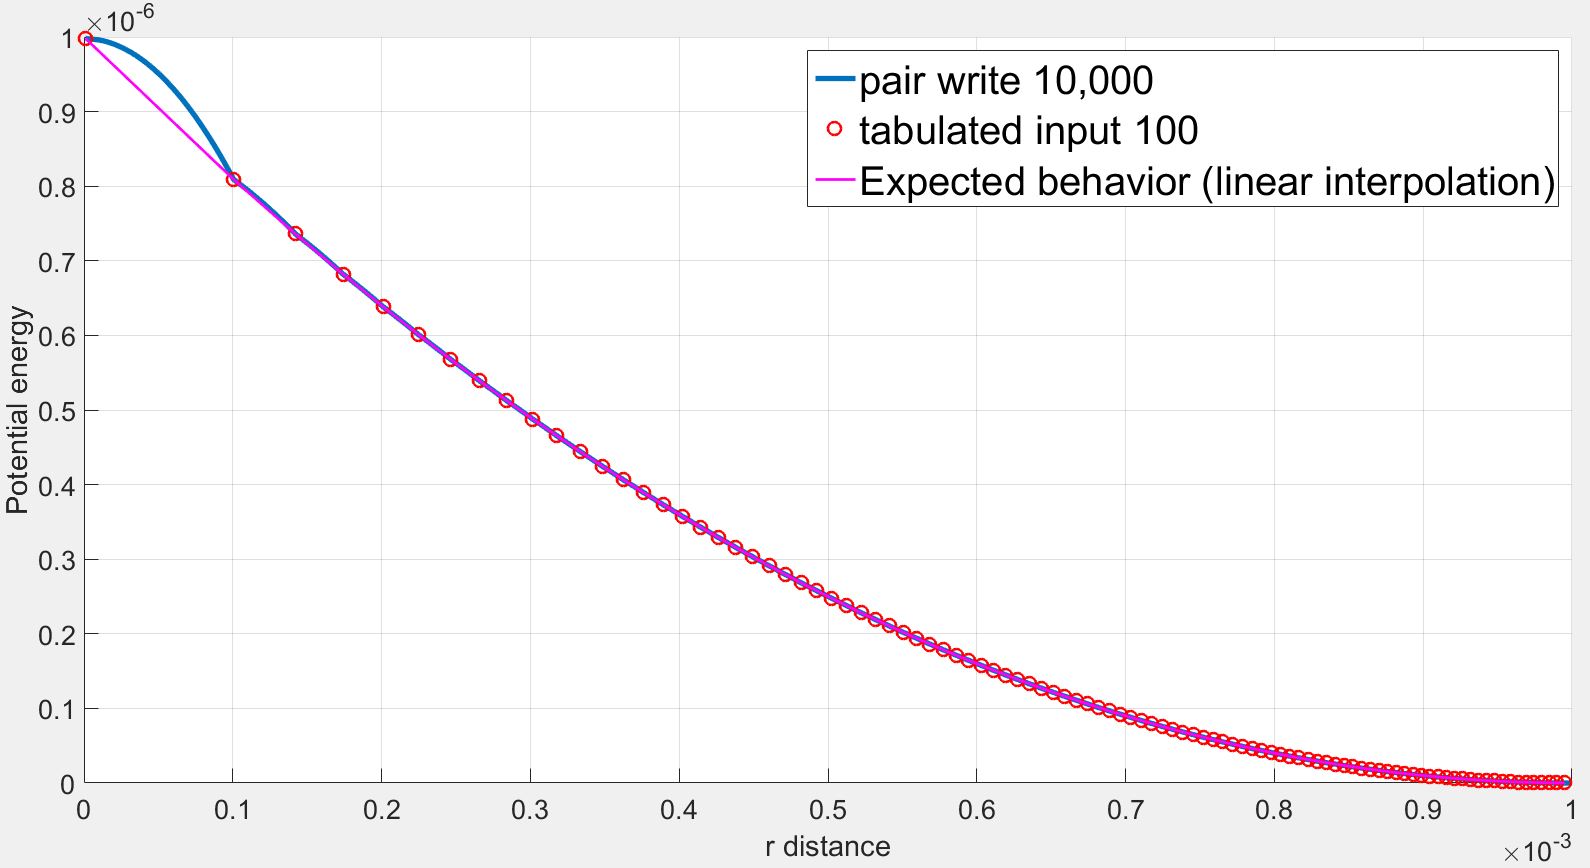
As we can see the force initially increases from r= 1.000000e-06 to r= 1.910920e-04 while the force should be strictly decreasing. The force finally decreases back to expected values.
I understand the problems of fitting splines to steep potentials and interpolating over these splines as discussed here: (https://lammps.sandia.gov/threads/msg40459.html https://lammps.sandia.gov/threads/msg19967.html). I tried varying the number of points and the spacing without success.
However in my case, I use a finite quadratic potential that does not diverge when r=0. What is more, according to the documentation, using N = Nfile = Ntable and RSQ spacing the interpolation table should “match exactly what is in the tabulated file (with effectively no preliminary interpolation)”. I was therefore expecting that the values of force would be interpolated linearly between the tabulated values but that is not the case.
I would be most grateful if you have any explanation that can explain this phenomenon.
Best,
Jibril Coulibaly