Hey there,
I am running an MD simulation in the NVT ensemble after having minimized the energy of my simulation box at the same time that I allow the box to relax to ultimately achieve 0 pressure. The minimization is quite successful and I reach a microstate with corresponding 0 pressure for all normal and shear stress components. Afterwards, I take this same simulation box and I run 200 000 time steps with a time step of 20fs (I am working at the coarse grained level) in the NVT ensemble at 300K following the recommendations in the manual concerning the Tdamp value (i.e., $(100*dt)). Before doing so, I use the command to set velocities to my superatoms so that the kinetic energy corresponds to a temperature of 300K (it was 0 by default beforehand). The thermostatting is the default one of the fix NVT command.
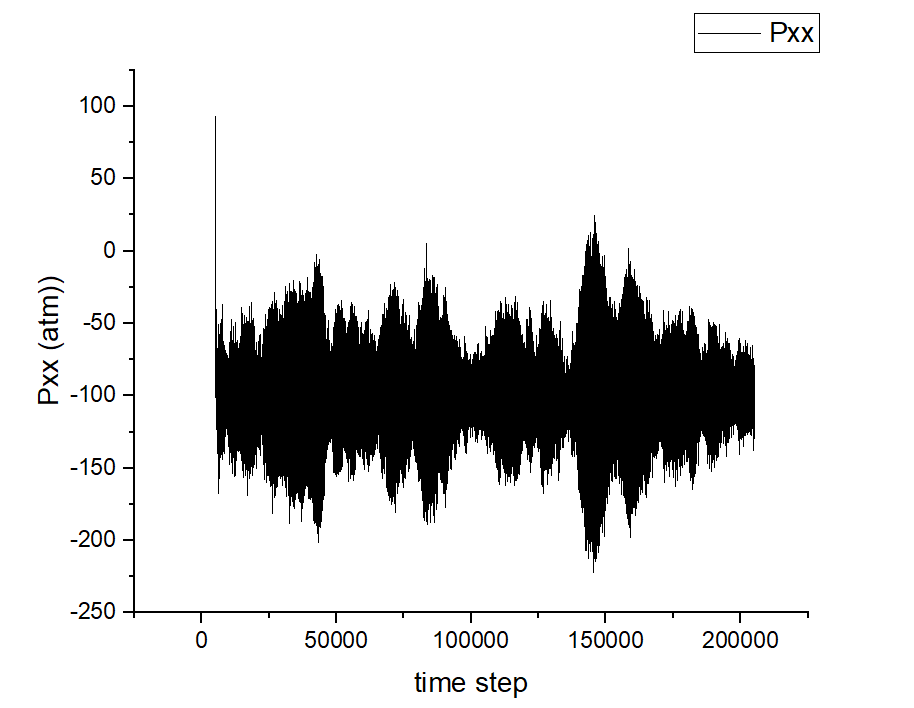
The thing is that I am getting some sort of patterns in the profile of all the six components of my stress tensor as a function of time step. I am attaching here the plot of pxx corresponding to the MD portion of my input obtained from the log.lammps file as an example. Does anyone know why I am getting this sort of correlation? Can I still trust the average value of Pxx regardless?
Disclaimers: the patterns happen independently of varying the value of the Tdamp constant, my simulation box is not at all small (it has around 6000 superatoms) and, in principle, there really shouldnt be anything absurd with my potential. The pattern continues to exist also if I simulate longer.
PS: I am sorry if the question has already been asked, but I couldnt find it in the mailing list with the different keyword I tried to type.
Best,
Cecilia