Hi All,
I’m looking to get the boundary lines of the pourbaix stable domains in a particular material at a few different concentrations. Using get_pourbaix_domains I can get a series of vertices which I can plot to get the attached diagram.
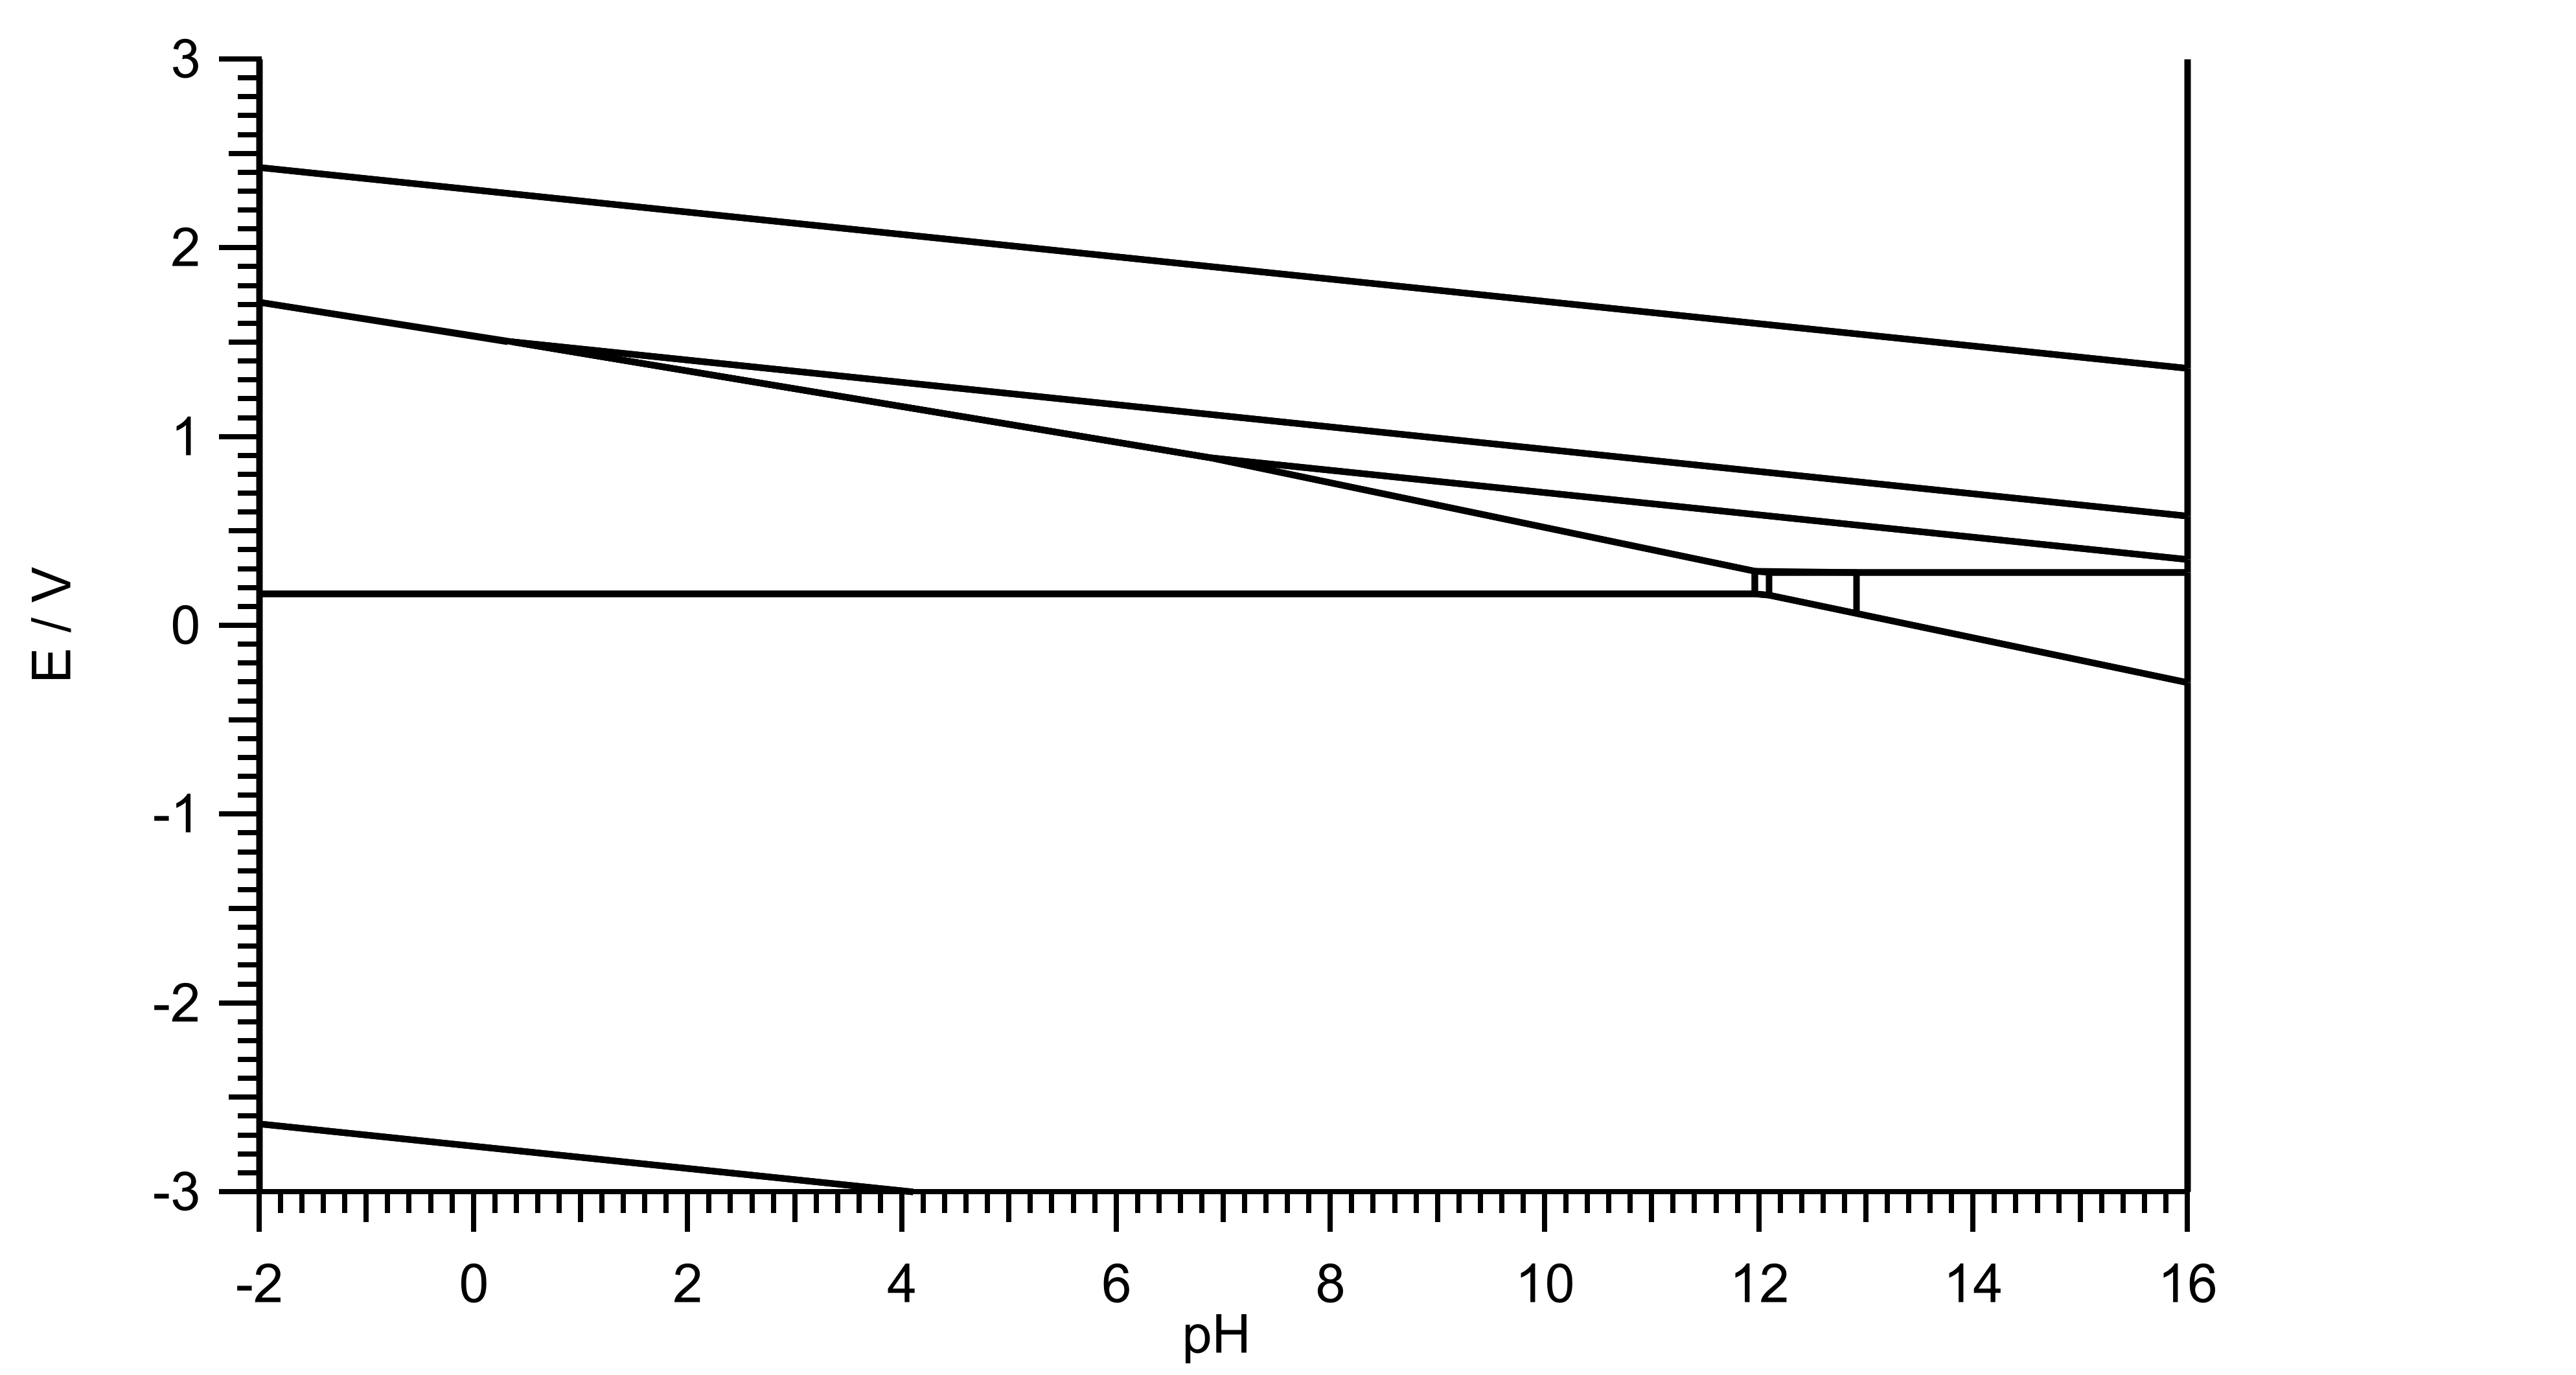
The trouble is that although they bear some resemblance to the diagram generated with the pourbaixplotter, they clearly don’t match up properly. In addition there doesn’t appear to be a change in the vertices with respect to changing concentrations which is clearly observed in the PourbaixPlotter and is also observed when using get_decomposition_energy. My python/pymatgen knowledge is quite cursory so I may be approaching this wrong. Any advice welcome. Code used below.
from getpass import getpass
from pymatgen import MPRester, Composition
from pymatgen.analysis.pourbaix_diagram import PourbaixDiagram, PourbaixPlotter, MultiEntry
import numpy as np
import pandas as pd
import matplotlib.pyplot as plt
mpr = MPRester(api_key=‘****************’)
form = ‘Ag2O3’
mpid = ‘mp-11872’
comp = Composition(form)
chemsys = comp.to_data_dict[‘elements’]
compdict = comp.fractional_composition.get_el_amt_dict()
pbx_entries = mpr.get_pourbaix_entries(chemsys)
ref_entry = [entry for entry in pbx_entries if entry.entry_id == mpid][0]
ref_mentry = MultiEntry([ref_entry])
pbx_diagram = PourbaixDiagram(pbx_entries,
comp_dict={k: v for k,v in compdict.items() if k not in [‘H’, ‘O’]},
conc_dict={k: 1e-6 for k in compdict.keys() if k not in [‘H’, ‘O’]},
filter_solids=True
)
pplt=PourbaixPlotter(pbx_diagram)
pplt.plot_entry_stability(ref_mentry)
PbxDom = pbx_diagram.get_pourbaix_domains(pbx_entries)
print(PbxDom)