Hi,
What is the difference between Phase Diagram app on the website and the PhaseDiagram class in the API? When I use the app to generate a “phase diagram” between two materials, the app shows that they are on a tie line (there is no decomposition).
However, when I use the PhaseDiagram and ReactionDiagram classes to build and plot a phase diagram based on all the entries in the chemical system, the phase diagram I generate shows some amount of decomposition (which is what I would expect).
Does the Phase Diagram app have any “knowledge” of the other entries in the chemical system?
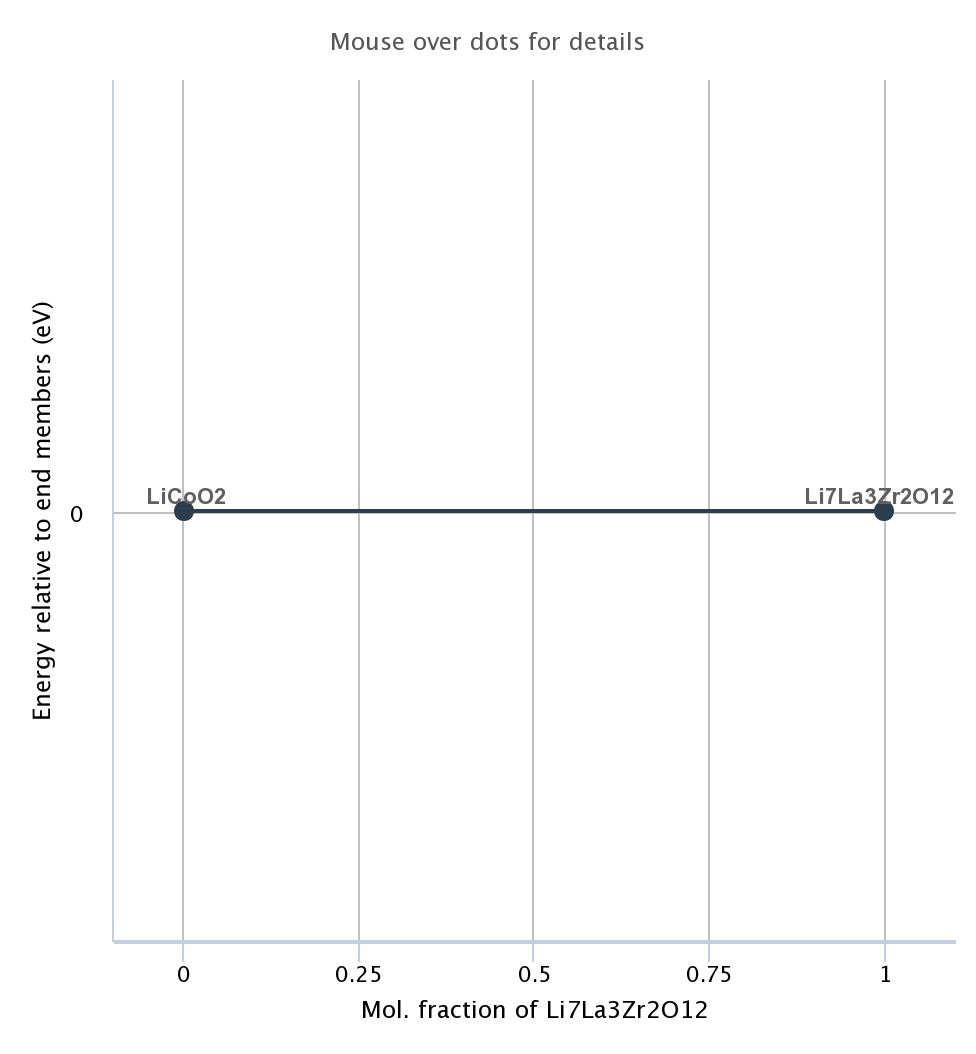
If you are trying to determine reaction products at the interface of two materials, check out the Interface Reactions app, which will try to predict likely products and relevant reactions. I think an issue with having Li7La3Zr2O12 as a phase diagram endpoint is that it’s not stable.
Thanks, this is helpful.
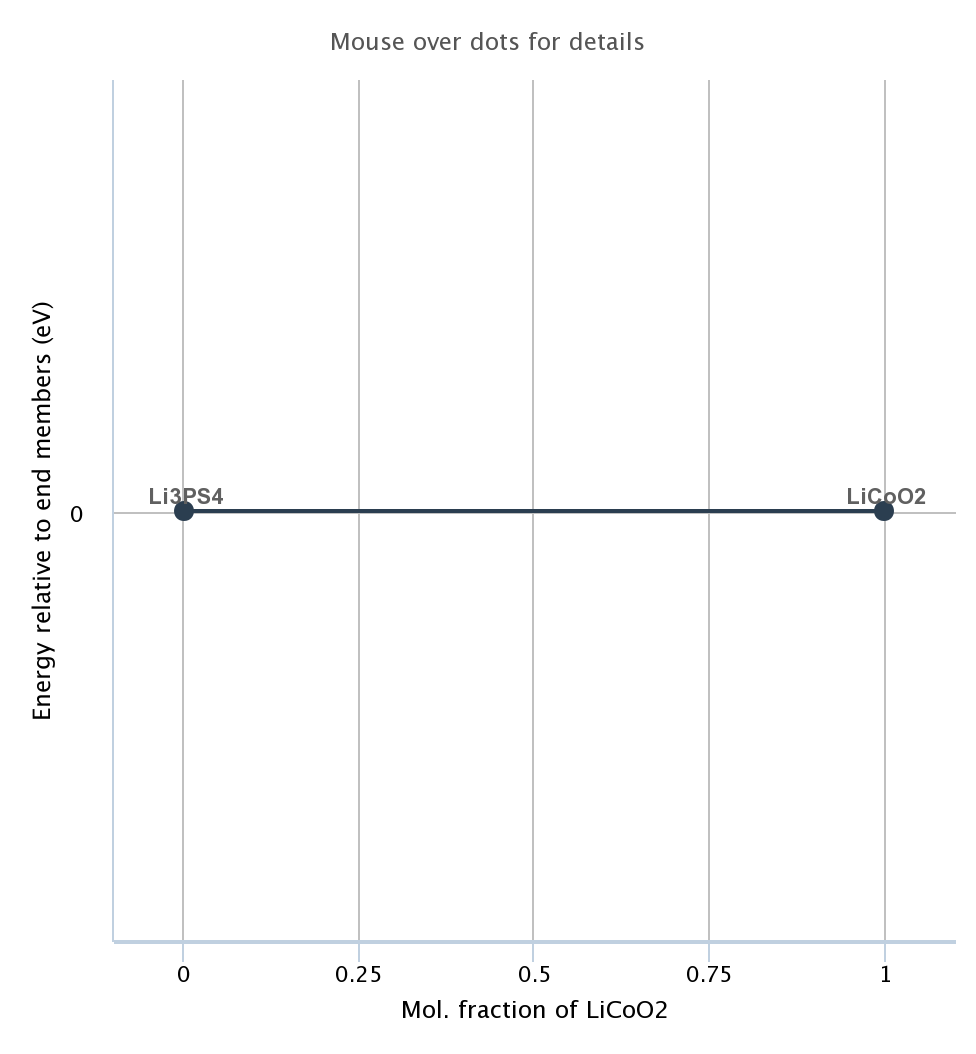
For the phase diagram question, though, I get the same result when I use a stable endpoint (Li3PS4, for instance) which still should react with LiCoO2.
Is what I am finding (with my two different results of stability) a difference between how the App and the API are implemented? If so, is there any way for me to find out what the differences are?
This appears to be a legitimate bug in the compound phase diagram on the website. It appears that its just getting entries at the compositions it’s given, so it will never find the intermediate reactions. We’ll investigate further.
For now, I’d say you’re building phase diagrams correctly on your computer. Your other option is to use the interface reaction calculator.