Hi all,
I’m attempting to plot the phonon band structure of an orthorhombic crystal with:
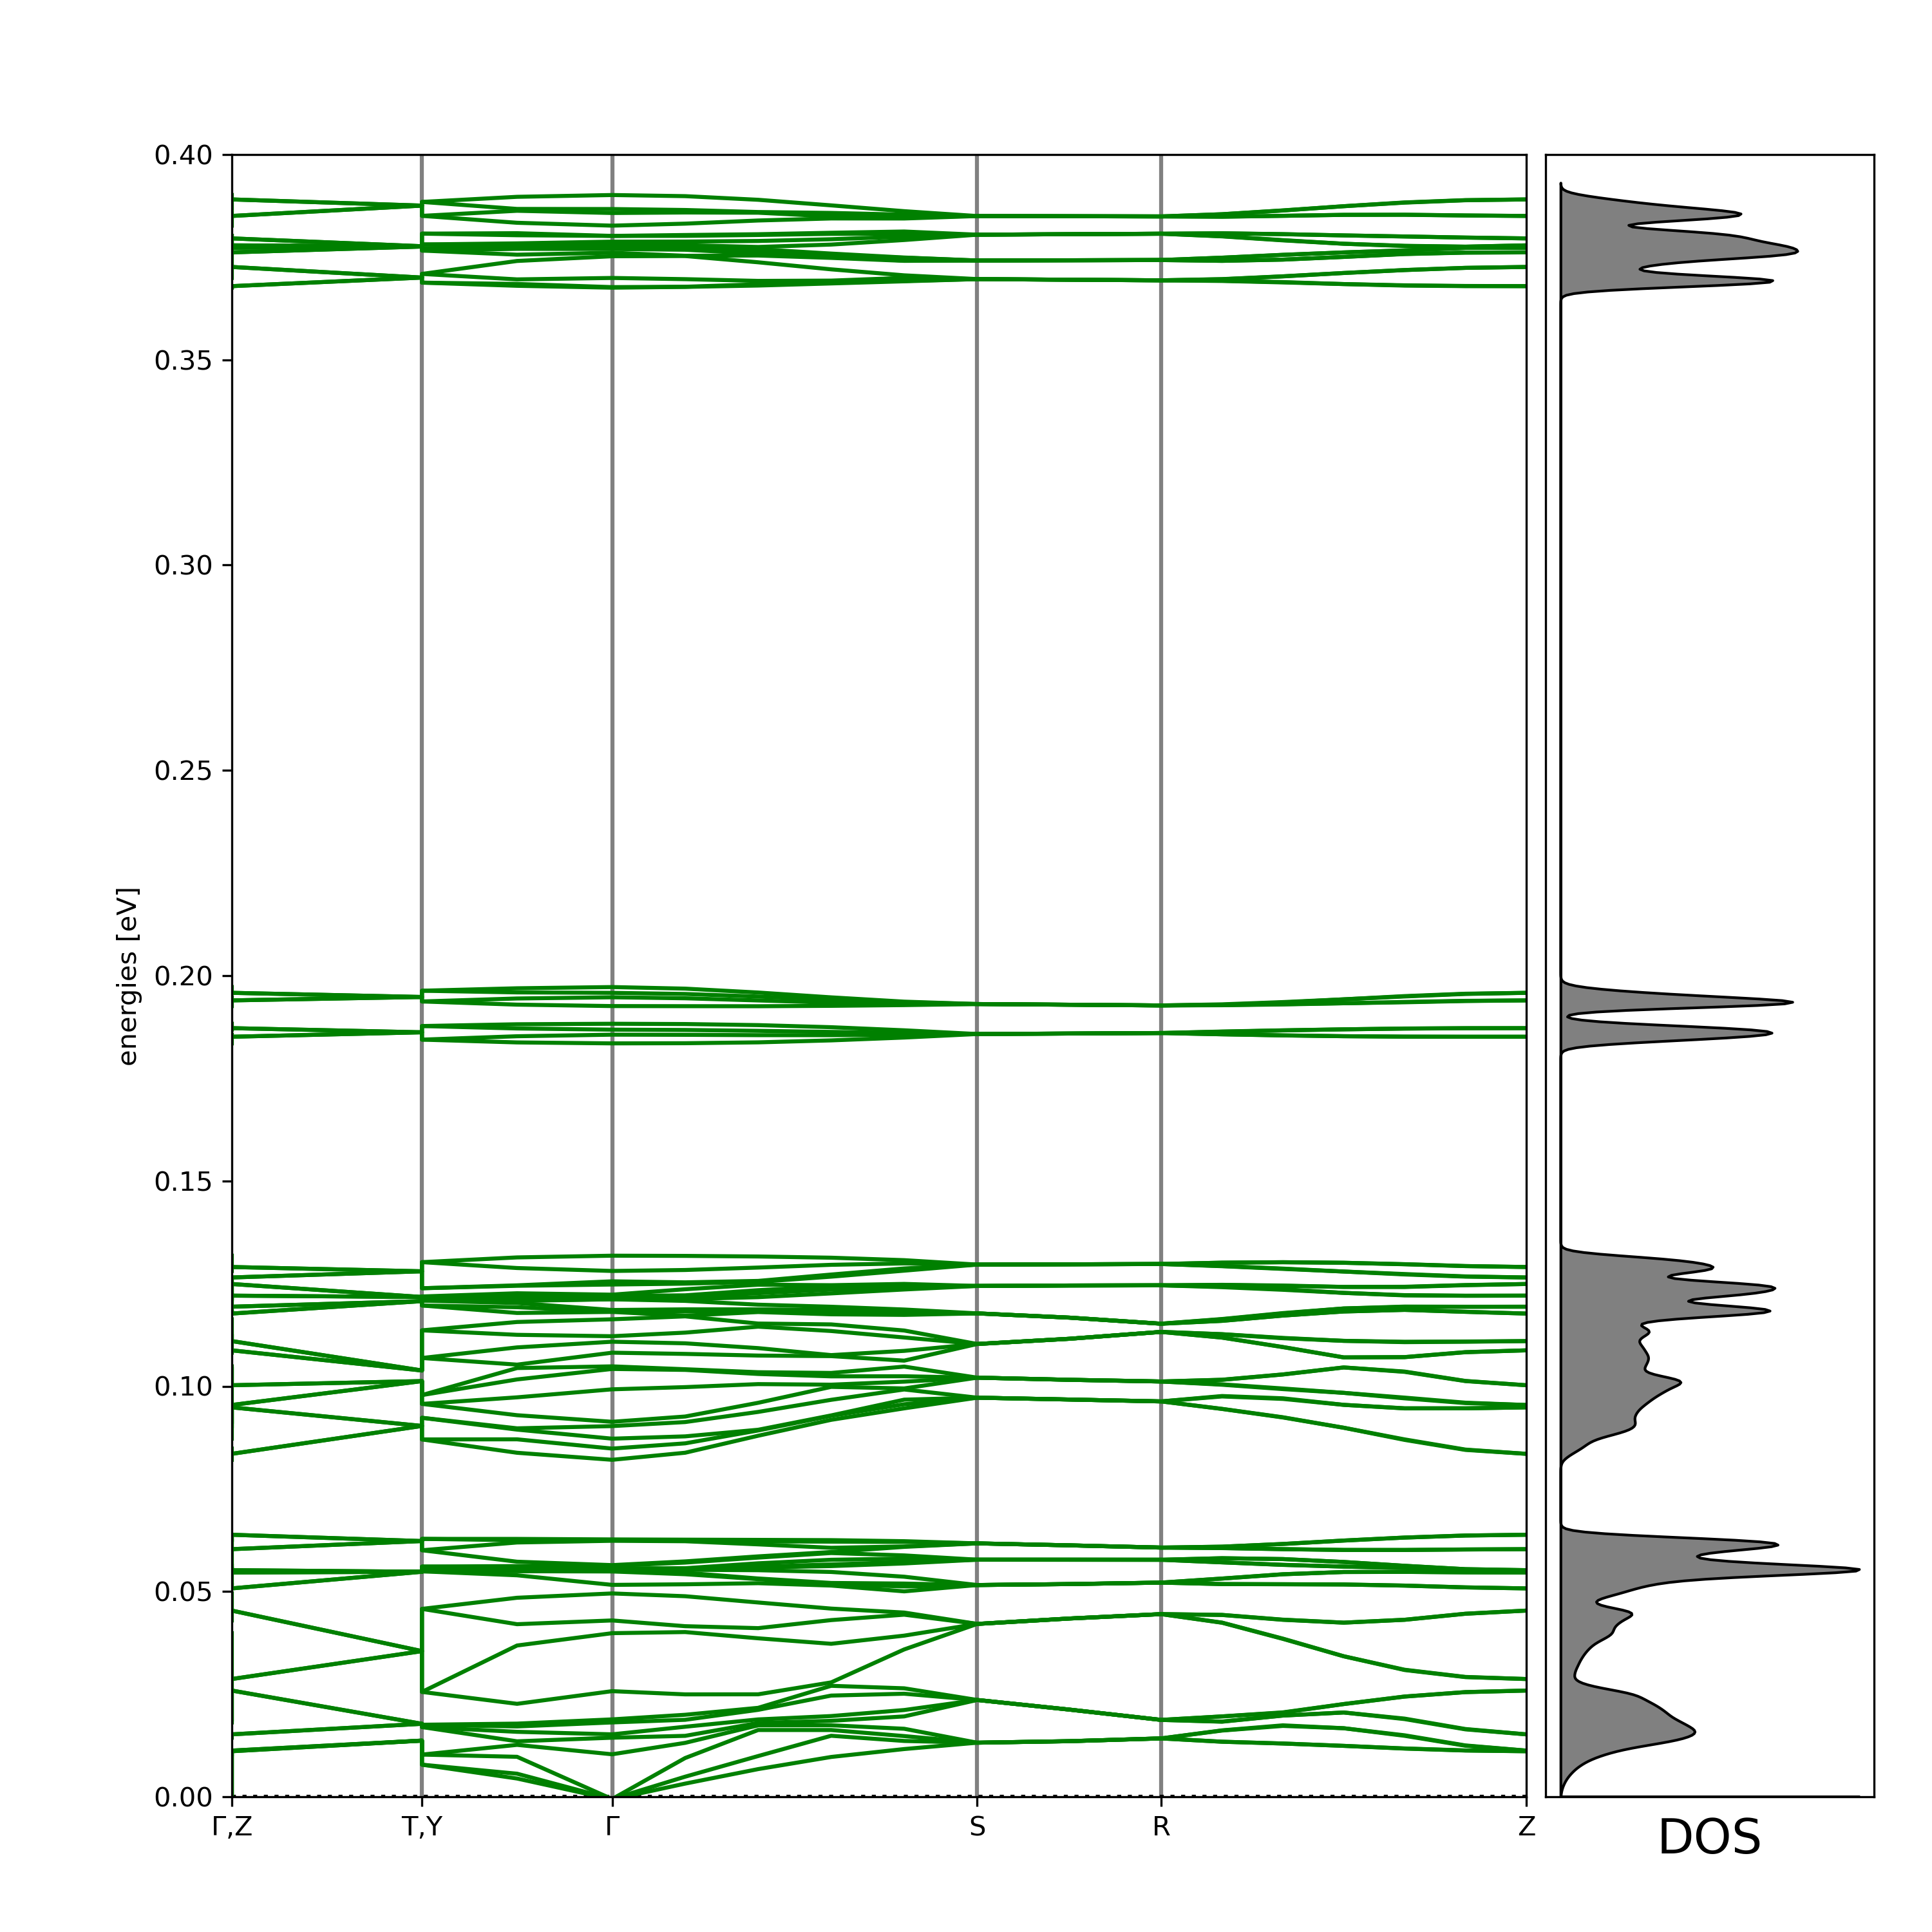
path = molecule.cell.bandpath('GZTYGSRZ')
bs = ph.get_band_structure(path, modes=True,verbose=False)
dos = ph.get_dos(kpts=(20, 20, 20)).sample_grid(npts=1000,width=1e-3)
# Plot the band structure and DOS:
import matplotlib.pyplot as plt # noqa
fig = plt.figure(1, figsize=(10, 10))
ax = fig.add_axes([.12, .07, .67, .85])
emax = 0.4
bs.plot(ax=ax,emin=0.0, emax=emax)
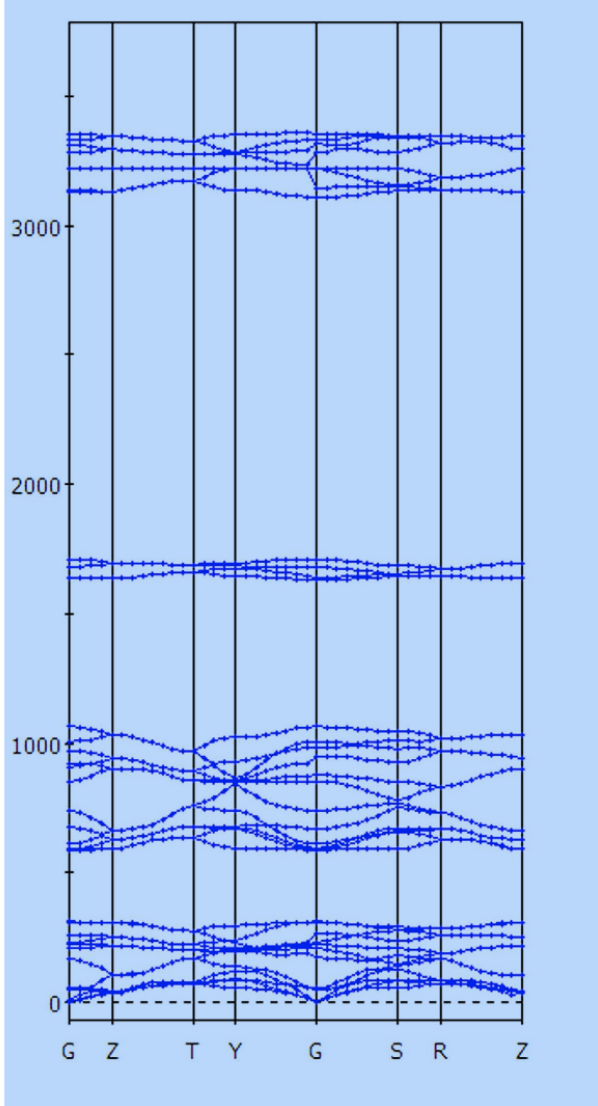
This may be a simple fix, but I can’t seem to get each special point to be placed on its own vertical line, if that makes sense. In other words, I want to make it so the gamma and Z points and the T and Y points are separate entries on the x axis. I’ve attached my figure phonon.png and what I want it to look like (phonon_1.png)