Problem with my MSD plot

Dear lammps user

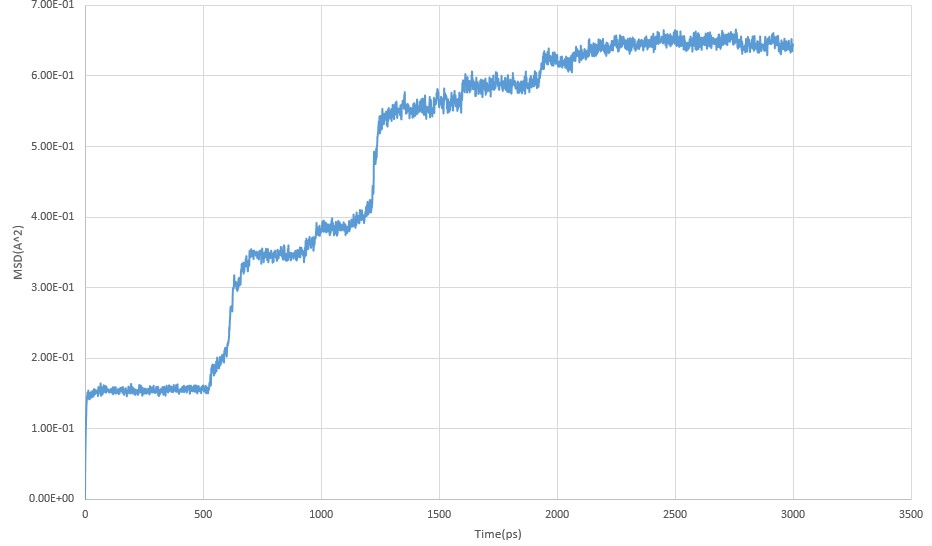
I tried to calculate diffusion coefficient thus I plotted MSD vs Time, so I used "fix Lithium_MSD Sodium ave/time 10 10 100 c_msd[1] c_msd[2] c_msd[3] c_msd[4] “.
My pair style is " lj/cut/coul/long” and the time step is 0.0001.After 30000000 run, the result was confusing me! due to this plot, could you help me to understand in which part of my work is wrong?

pair_style lj/cut/coul/long 14 14
read_data NaZr2P3O12.data

kspace_style ewald 1.0e-5
kspace_modify gewald 1.0e-5

fix MM all box/relax iso 0.0 vmax 0.001
min_style cg

minimize 1.0e-12 1.0e-12 10000 10000
unfix MM
velocity all create 700 2547321 mom yes rot yes

run 200000

unfix NPT

fix NPT all npt temp 700.0 700.1 0.01 x 0 1 1 y 0 1 1 z 0 1 1
run 30000000

Have you tried visualizing the trajectory? This MSD plot looks like it represents a solid or glass.

Can we see your full input script? This snippet is missing a lot of information.

Sure!
My structure from NASICONs families.

dimension 3
boundary p p p
units metal
atom_style charge
timestep 0.0001
atom_modify map array sort 0 0.0
neighbor 3.0 nsq
neigh_modify delay 0 every 1 check yes

pair_style lj/cut/coul/long 14 14
read_data NaZr2P3O12.data

pair_coeff 1 1 0.00844 3.541 #O_O

pair_coeff 1 2 0.01083 3.844 #O_P

pair_coeff 1 3 0.00503 3.332 #O_Zr

pair_coeff 1 4 0.00331 3.508 #O_Na

pair_coeff 2 2 0.0139 4.147 #P_P

pair_coeff 2 3 0.0064 3.635 #P_Zr

pair_coeff 2 4 0.0042 3.811 #P_Na

pair_coeff 3 3 0.003 3.124 #Zr_Zr

pair_coeff 3 4 0.001 3.299 #Zr_Na

pair_coeff 4 4 0.0013 3.475 #Na_Na

kspace_style ewald 1.0e-5
kspace_modify gewald 1.0e-5

fix MM all box/relax iso 0.0 vmax 0.001
min_style cg

minimize 1.0e-12 1.0e-12 10000 10000
unfix MM
velocity all create 700 2547321 mom yes rot yes

thermo 1000
fix NPT all npt temp 700.0 700.1 0.01 x 0 1 1 y 0 1 1 z 0 1 1
run 200000

unfix NPT

fix NPT all npt temp 700.0 700.1 0.01 x 0 1 1 y 0 1 1 z 0 1 1

compute msd Sodium msd com yes

fix Lithium_MSD Sodium ave/time 10 10 100 c_msd[1] c_msd[2] c_msd[3] c_msd[4] file average-msd.txt

thermo 10000
thermo_style custom step temp pe c_msd[1] c_msd[2] c_msd[3] c_msd[4] etotal pxx pyy pzz lx ly lz
log result.txt

dump 1 all custom 100000 dump.lammpstrj id type x y z
run 3000000

And far as I can tell, your input looks fine, although I think the second NPT should be x 1 1 1, etc. instead of x 0 1 1. Same for the temperature (700.0 instead of 700.1).

I would visualize the system to make sure that it’s in the state you expect. That MSD plot looks like your system may be glassy.

Thanks a lot, I really appreciate

Dear,

Warm greetings. Can you please share the data file for NaZr2(PO4)3 with me? Also, could you provide me with the bibliographic reference for the potential coefficient values? Thank you.

Sincerely,
Edgar Matallana
[email protected]