Hello,
Recently, I was learning Pourbaix diagram on Materials Project, which I think it’s a very good tool for study. However, there are some Pourbaix diagrams show empty regions. Here is one example. I would like to ask the possible reasons to cause this if there is any clue can be provided. Thank you very much,
Hey Steven, this is just because of the specified pH_range and V_range of the code, it only does the computation with respect to those limits - but you can increase them, e.g.
PourbaixDiagram(entries, pH_range=(-2,16), V_range=(-5,5))
Hi Joseph,
Thank you for your answer!
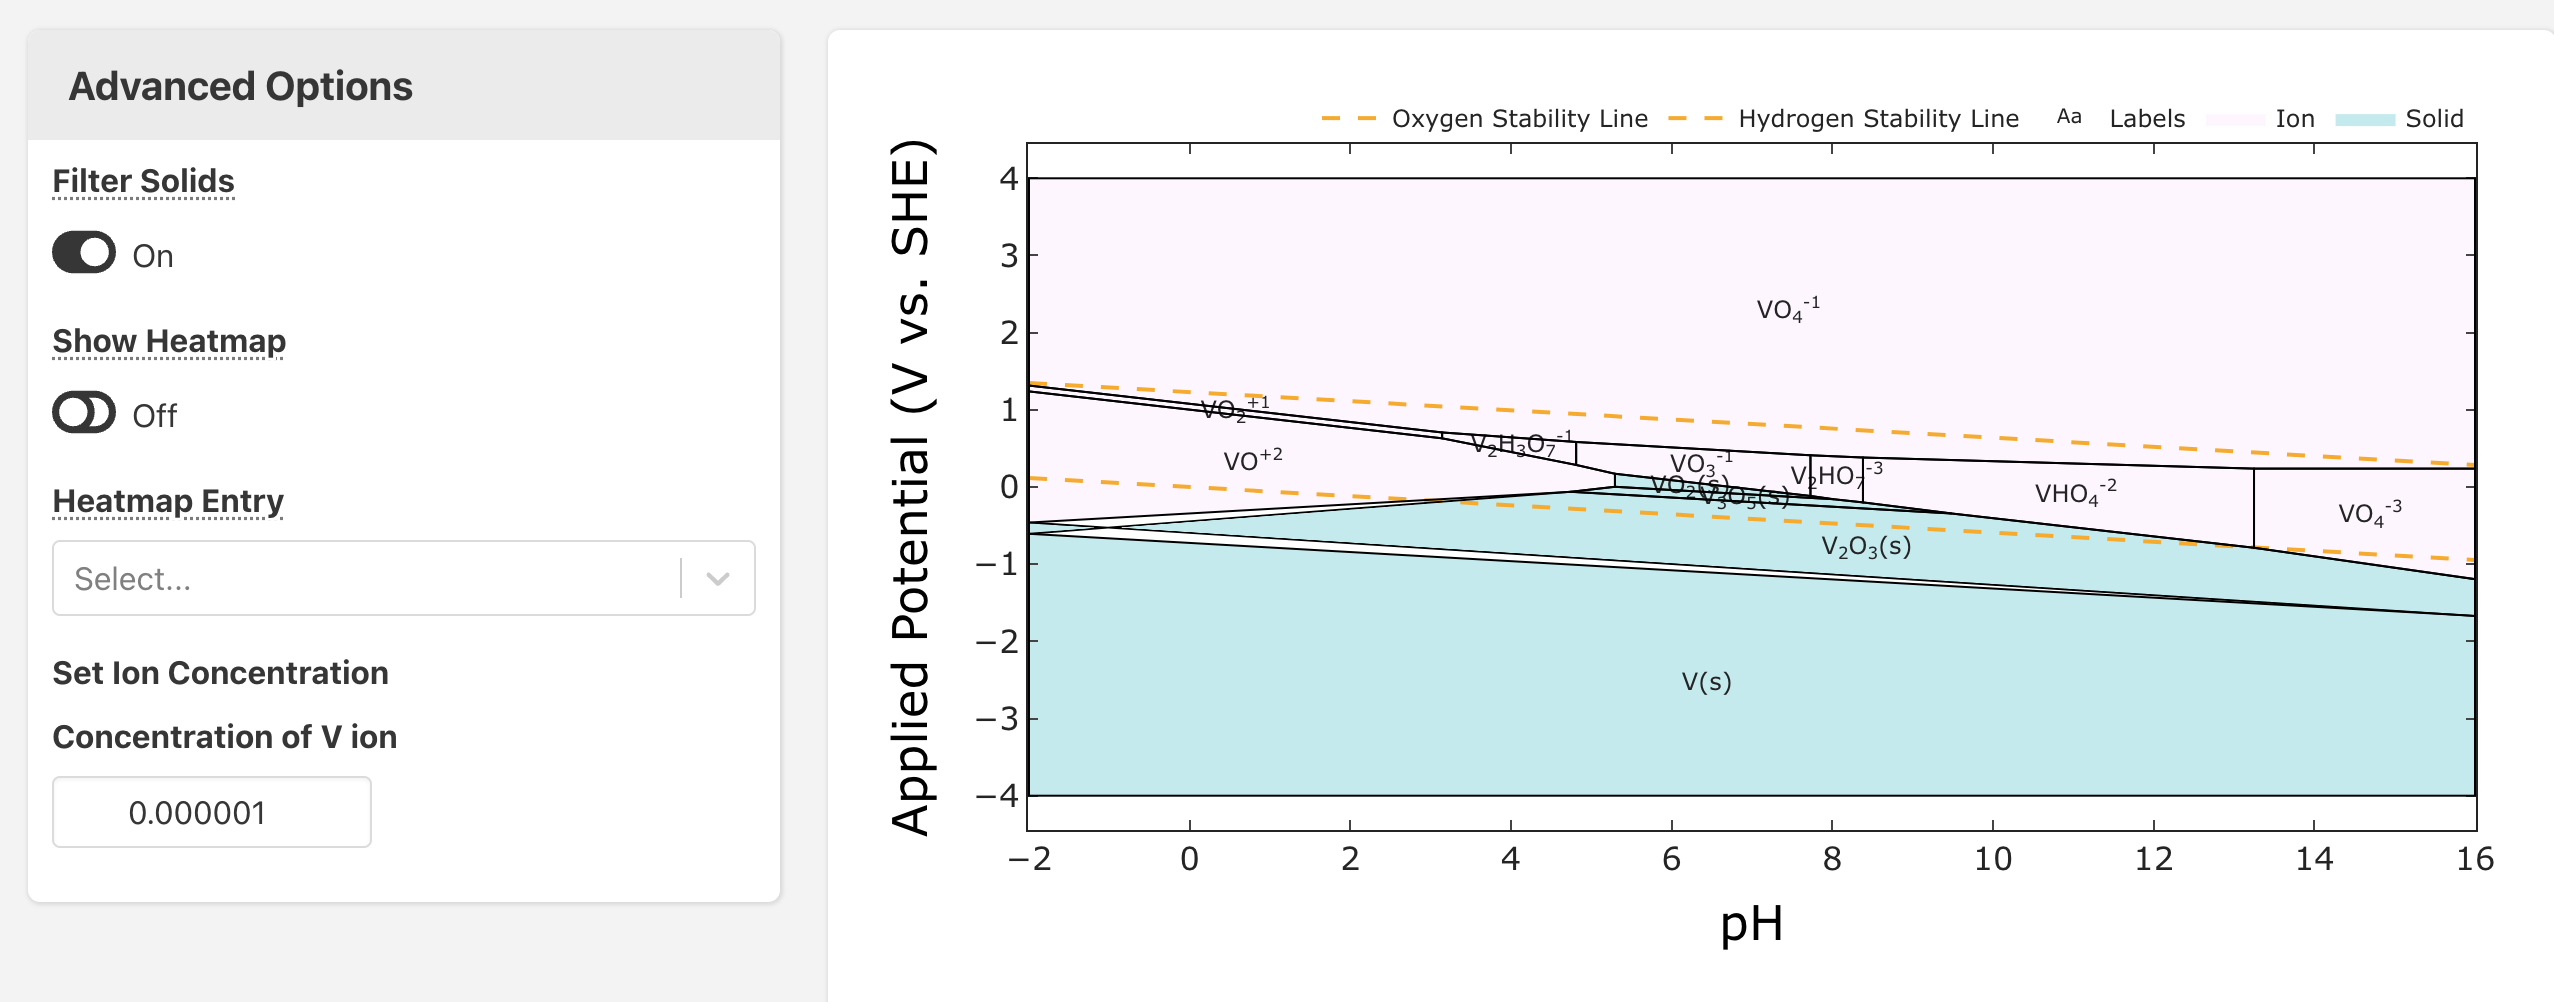
I think I didn’t make my question clear here. Sorry about that! However, what you mentioned is also very useful for my study, thank you! Actually, the empty areas I observed are on the left center of the screenshot in (or near) the V2O3 phase. I wonder if that is normal. Thank you!
Ah - I see. That looks like a bug - the way the plotting algorithm works is by drawing a polygon in matplotlib, so I’d guess that for some reason the vertices of the V2O3 region are out of order and the code is drawing lines and shading such that it looks like some regions are excluded. There’s some logic in pymatgen that attempts to sort vertices in a given pourbaix domain, but it might need to be updated.
1 Like
Hi Joseph,
I see, thank you for the help! I will look at and learn the code related to this part in pymatgen. Again, thank you very much!