Dear Lammps users,
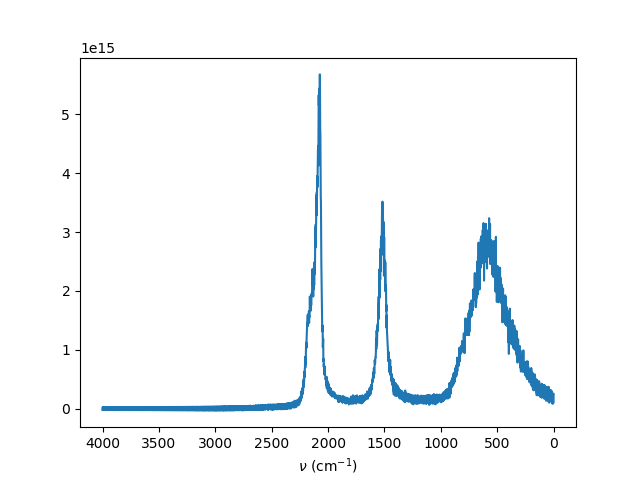
I’m writing to ask about my recent simulation with water. Briefly, I used flexible SPC/E potential ( Zhang et al. 2007 ) and start with Ice Ih and then eqilibrate it at T=300K to get the liquid water. At this point, I calculated g® O-O as well as density and it turned out that it is in good agreement with the reported data. Next, I tried to check the power spectra of the water with MD. I simply captured the dipole moment of the structure and used this data in a separate code to take the autocorrelation as well as the fourier transform of it. The final output is attached here where I can capture the first and second peak correctly. However, the third peak (stretching mode ) which should be over 3300 is captured around 2000 which is odd to me. I tried my simulation with different Tdamp, timestep, number of step, ensemble, and different ave/time. However, none of them changed the final output significantly. Also, I searched the previously raised questions in the forum to find similar concerns. But, I had no success.
So, I wonder if you might be able to share any clues or comments. I’m aware that it is quite a specific problem, and I appreciate any comment. You can find my input file bellow.
Thanks,
A.S.
#-------------------------Input command --------------------------------
units real
boundary p p p
atom_style full
read_restart 300K.equil
pair_style lj/cut/coul/long 10.0
pair_coeff 2 2 0.1502629 3.1169 # Oxygen
pair_coeff 1 1 0.00774378 0.98
pair_coeff 1 2 0.0341116368 2.04845
bond_style harmonic
bond_coeff 1 176.864 0.9611
angle_style harmonic
angle_coeff 1 42.1845 109.4712
kspace_style pppm 1.0e-5
neighbor 2.0 bin
neigh_modify delay 0 every 1 check yes
timestep 0.5
fix 2 all nvt temp 300 300 100
fix Binput all ave/time 1 1 2 v_mytime v_dipolex v_dipoley v_dipolez file A.txt mode scalar
run 2000000