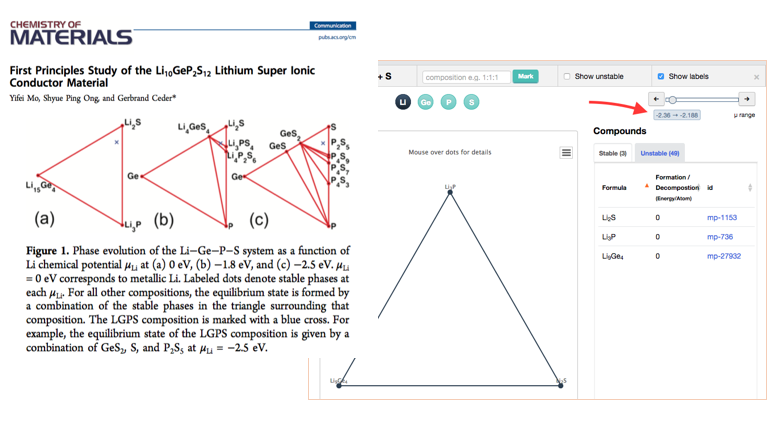
I have a very quick and simple question on the phase diagram app. I came across a paper by Prof. Cedar where the phase evolution of Li-Ge-P-S system as function of Li chemical potential is reported, as shown below. On the figure (left), the phase diagram at three chemical potential, 0, -1.8 and -2.5 eV is presented. However, The chemical potential of an open element in the app is given in ranges. I was wondering how the exact potential values were obtained (in the paper) from the ranges given in the app.
There are critical chemical potentials for the open element in the grand potential phase diagram corresponding to transitions; we use pymatgen.phasediagram.analyzer.PDAnalyzer.get_transition_chempots to obtain these, and they are the endpoints of the ranges displayed. The exact μ value used to construct the plot for each range is the average of the endpoints of the range, with the exception of the last range, which is plotted at the value of the last endpoint minus 0.1. This gist summarizes our process (note the avgchempot variable), and introduces one to programmatically generating such diagrams using MP data.
To MP team,
I think this is a common confusion, i.e., people don’t aware -1.91eV shown there as the chemical potential mu of elementary Li (unless the user has run VASP in PBE for Li metal him/herself).
This may be easily fixed in the Web GUI design, e.g. specifying in the GPPD what is elementary mu, or simply referencing all mu to the elementary state.
I was wondering how do you determine the chemical potential of Li. The chemical potential of Li is the control variable in determining the grand potential. However, the chemical potential is dependent on the mole fraction of Li in a system: mu_Li= mu_Li_o+RT ln (activity) where activity= gamma(deviation from ideality)*x_Li
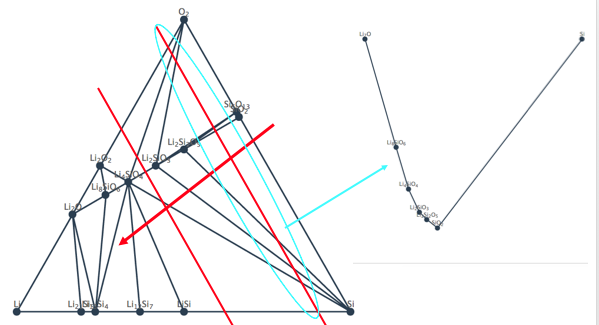
The way I understand the extraction of the stable phase at a given chemical potential from ternary phase diagram is like what I shown in the image attached. I move the red line towards the Li (increasing x_Li) and what the line cross determines the stable phases at that chemical potential of Li (aka x_Li). But it is not clear from what can of solution model you used to convert the x_Li to mu_Li.
Hi @Tim, hopefully our full documentation for the phase diagram app here can be of help. There is some explication there, particularly under the “Thermodynamics Methodology” section.