Dear lammps user,
My lammps version is 7 August 2019.
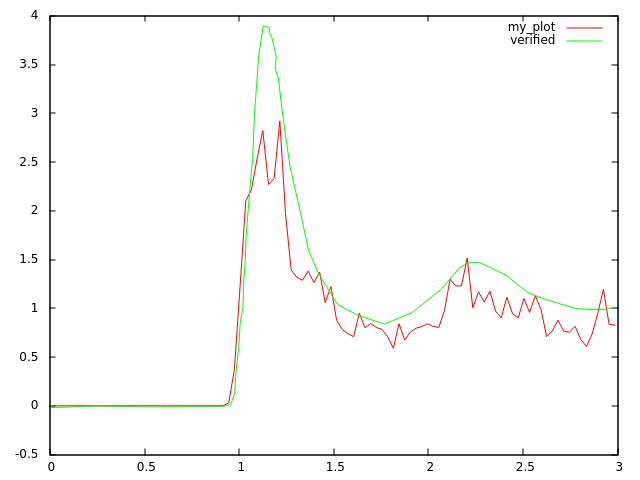
I am trying to produce the radial distribution function for a two dimension Lennard-Jones fluid at several temperature. For the reason of comparison with some verified results, let us use the following quantities:
the reduced temperature is 0.6, the reduced density is 0.3 and the desired number of particles is 256.
I could produce the radial distribution function for such system, but the height of the peaks are not as the verified one, which is around 4 as it is shown in the attached file named RDF.
The lammps script I wrote is written below.
Could you please tell me why my lammps script produce RDF (titled as “my_plot” in the attached file) whose height is much less than the verified one?
I notice that if insert the reduced temperature in my script equaled to (0.6/2 =0.3), then the height of my_plot becomes equaled to the verified one. The point is that the verified plot was simulated at a reduced temperature = 0.6 for NVT ensemble using mone carlo simulations.
The form of the potential for the verified graph is exactly the same as one in the command pair_style lj/cut in lammps documentation. The potential was cut at 2.5*sigma.