Dear Users,
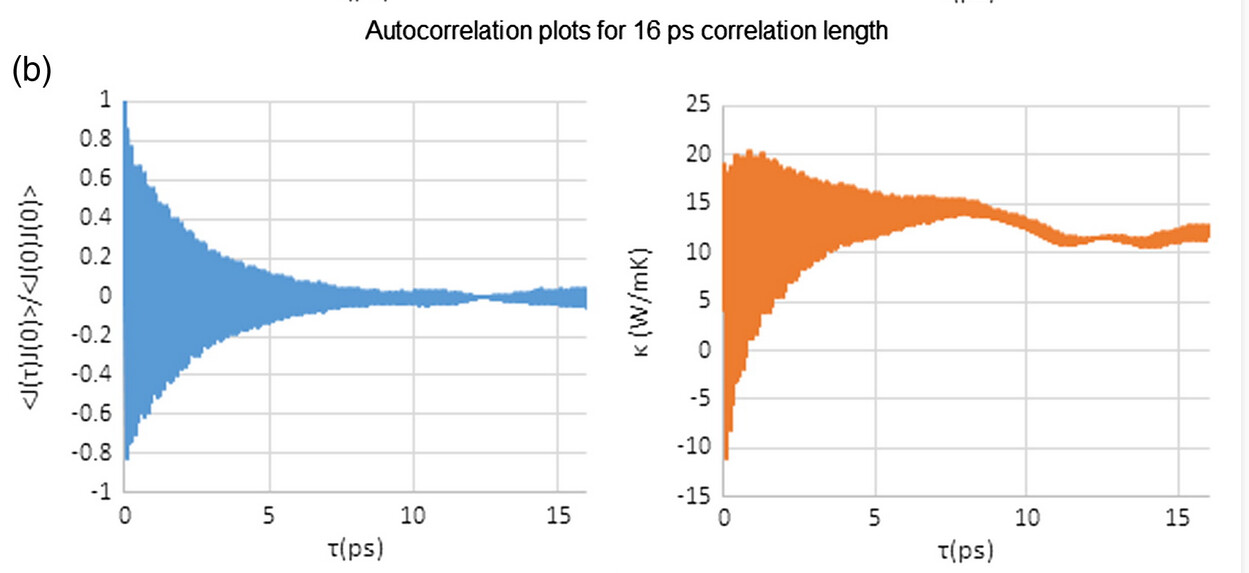
How to plot RTC (running thermal conductivity) as a function of correlation time like the one shown on the right side of the attached image?
I mean I can print values of kappa in 3 directions after every $d(= $s*$p) time steps in lammps script. So, what i would get is thermal conductivity vs runtime graph not kappa vs correlation time graph.
It would be best to get that information from the authors of that figure. It’s not a LAMMPS-specific problem, but a conceptual problem of “how can I reproduce this data”. Once you get a good idea of which data are necessary to compute your answer, we can help with getting LAMMPS to produce that data.
Yes, it’s not a lammps specific problem. I saw this kind of graph in many other papers too. (attached below)

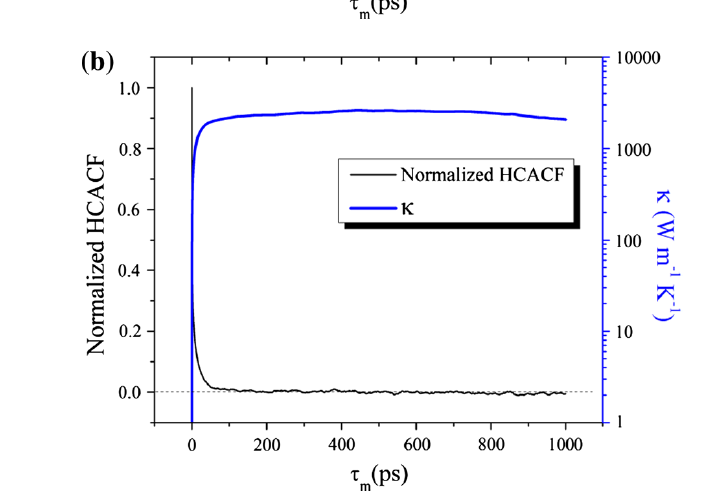
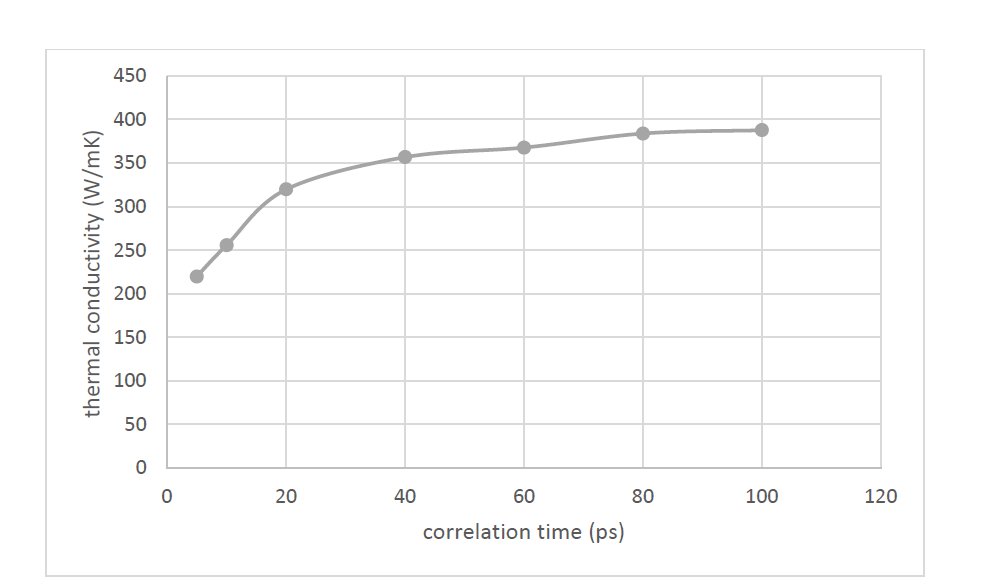
In that case do I have to collect running average TCs for different correlation time and then plot it like the one attached below?
But the plot in my post seems quite different. So I was thinking about the data collection process.
And yeah I am trying to contact the author of that paper.
Thanks.