I have been working on a LAMMPS script to calculate the activation energy of a dislocation formation at the yield point of a sample. I have located the timestep at which I get my first dislocation loop, but my current problem is trying to create a final configuration.
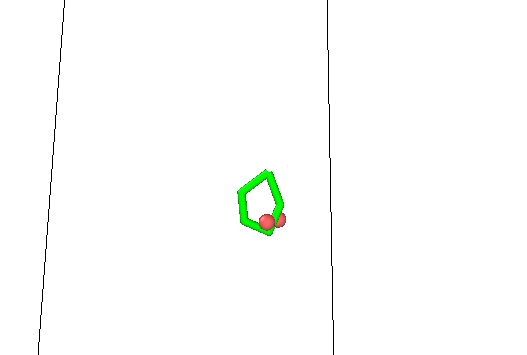
I had initially assumed that the final positions of the 2 atoms featured in the image would be the required final configuration that will undergo NEB minimization, but I ended up getting results like so:
0   -1157421.3
0.067736653   -1157421.3
0.13525519   -1157421.3
0.20277427   -1157421.3
0.27005197   -1157421.3
0.33620088   -1157421.3
0.40129532   -1157421.3
0.4668318   -1157421.3
0.53421089   -1157421.3
0.60199061   -1157421.3
0.66886634   -1157421.3
0.73632504   -1157421.3
0.80146506   -1157421.3
0.86684302   -1157421.3
0.93398332   -1157421.3
1   -1157421.3
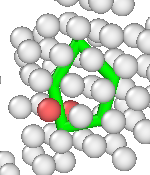
I believe I have not figured out how to represent the dislocation in a manner that would be possible for NEB to minimize. Should I select a bunch of atoms surrounding this dislocation like the image below?
Knowing that it is not possible for a generic config for all problems, I would like to understand what could be the ideal final configuration in this type of simulation?
A NEB calculation maps out the path of lowest potential energy between two local minima.
Thus you basically have to minimize your initial configuration and then also construct and minimize your final geometry. For constructing the input for the NEB calculation you then need to compare the two minimized structures and determine which atoms show a significant displacement between the two geometries and provide only those displaced positions in the NEB final configuration file.
1 Like
Thanks for an answer!
Is it better to compare the states visually or through a data analysis method? This system contains 200000 atoms, and it would prove hard to visually identify the exact differences in positions between two states.
This is the first time I have had to think about something like this, any pointers would be helpful!
That really depends on your skill levels with either visualization or data analysis and the nature of the system change you want to study. By definition, you know which atoms are affected to induce the transition you want to study. Specifying those coordinates may be sufficient. You can confirm this through visualization. Otherwise, LAMMPS has a compute displace command, where you can monitor how much atoms have moved since the compute was defined. In combination with the dump_modify thresh option you can let LAMMPS create a dump file with only those atoms included that have moved more than a given threshold. That file should be straightforward to transform into the format needed for the NEB calculation as final coordinate input.
1 Like