My goal for this project is to attempt dislocation of atoms on a section of the Al Lattice.
I have been trying to perform NEB on a 20x20x20 FCC lattice, but on every single iteration I’ve been getting wildly different results, and observed extremely chaotic results in the dump files.
units metal
dimension 3
boundary p p p

atom_style atomic
atom_modify map array sort 0 0.0

variable u uloop 100
lattice fcc 4.046
region  box block 0.0 20.0 0.0 20.0 0.0 20.0
create_box 1 box

create_atoms 1 box

pair_style eam/alloy
pair_coeff * * Al99.eam.alloy Al
write_data initial.lmp

region surround block 8.0 14.0 8.0 14.0 18.0 20.0
group nebatoms region surround
group nonneb subtract all nebatoms

minimize 1e-10 1e-10 10000 10000
reset_timestep 0

timestep 0.001

thermo 		100
thermo_style 	custom step pe vol press pxx pyy pzz ke temp

fix             1 all nve
run             10000
unfix           1

fix		2 all npt temp 1 300 0.1 iso 0 0 1
run 		20000
unfix 2

fix		3 all npt temp 300 300 0.1 iso 0 0 1
run 		10000
unfix 3

fix 4 all nve
run		10000
fix	5 nebatoms neb 1.0

thermo 		100
thermo_style 	custom step pe lx ly lz xy xz yz vol press pxx pyy pzz ke temp

dump		1 nebatoms atom 10 dump.neb.$u
dump		2 nonneb atom 10 dump.nonneb.$u

min_style quickmin
neb		1e-10 1e-10 300000 300000 1000 final finalstate.lmp
Ran using: mpiexec -np 16 lmp_mpi -partition 16x1 -in in.neb > output.txt
ERRORS NOTICED:
-
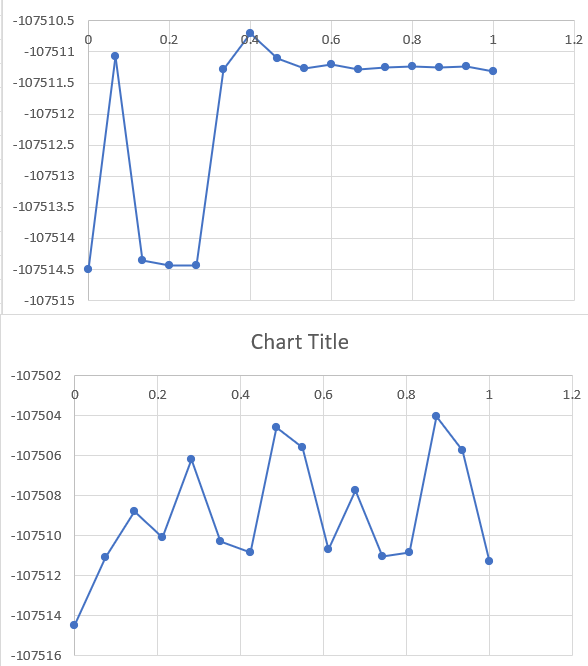
Wildly varying results between different NEB Runs - attached below
-
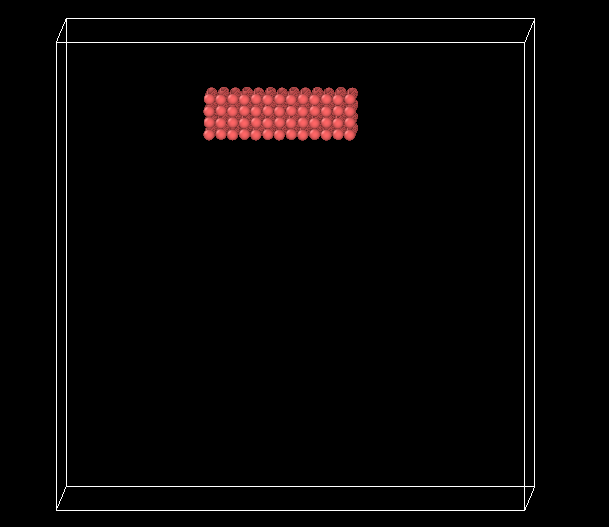
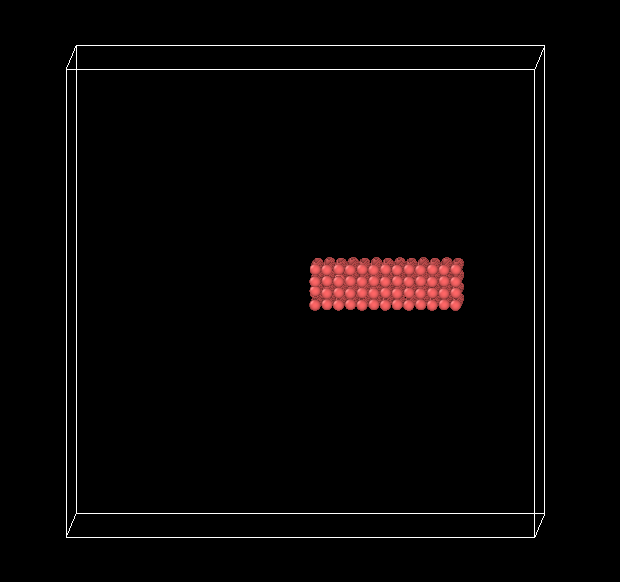
nebatoms present in a different space w.r.t. the assigned location
(timestep 6611)
to
(timestep 6612)
-
The atomic positions in the written data file initial.lmp and the nebatoms dump file are completely different. I tried changing the finalstate.lmp to match the nebatoms dump during the next run, and I got even more chaotic results, with the nebatoms at the same location.
I’ve tried different things like setting a lower temperature (100K), removing few of the fixes. I’m not sure how to begin to get a stable run, as well as how to perform a hop-adatom style dislocation analysis.
What do you mean by “wildly varying results”? When I look at your y axis I don’t see a noticeable difference, on the contrary for a numerical result it seems quite remarquably reproducible.
First off, please always report which LAMMPS version you are using.
There are multiple things that I don’t understand, so please provide some additional explanations:
- you talk about using NEB, which is based on minimization which means calculations at 0K. Yet your input contains multiple MD runs in an order that doesn’t make much sense (first a minimization, then fix nve, i.e. no thermostat, then a quench from 300K to 0.1K, then a chunk starting from 300K target and remaining at 300K (which will negate the quench), followed by another chunk of fix nve and followed by the NEB run. What is the purpose of this very unusual and counter-intuitive simulation protocol?
- you talk ab out “wildly different” results, but the delta between the displayed energies is 5-10 eV that would be on average about 200 ueV per atom. Would you call that a lot?
- what is it that your plots are showing? There are no axis labels, no units, no explanation. If I had produced such plots when I was in college (e.g. in physical chemistry lab), I would have been “given the business” by my teaching assistants for doing shoddy work.
- what do you mean by “extremely chaotic results in the dump files”? which part of your input do your timestep numbers refer to?
- how can it be that the same calculation with the same input on the same computer with the same command line arguments would give different results? so something has to be different between those runs.
I will repost the question after analyzing your comments, and respond with a more detailed, well written post. Thank you for your patience in dealing with me.
I apologize for the poorly worded question. Due to your suggestions, I was able to figure out that it’s pointless to run npt/nve with NEB as it resets the temp to 0K when performing NEB anyway. I got relevant results by just removing the npt/nve part of the code. The graph was a Potential Energy vs Reaction Coordinate graph, from the output of NEB method.
The variations in the results were due to change in initial atomic position caused by npt/nve. I had a fundamental lack of understanding that minimizations meant calculations at 0K.
Thanks for your guidance. I will perform the due diligence the next time I post questions/issues.
2 Likes
Thanks for reporting back with the detailed explanations and good to see that you figured it out.
This will help people in the future that will search the forum encountering similar issues.
2 Likes