slope(f_msd) in DIFFUSE

Hi LAMMPS users,

I have only 2 months experience using LAMMPS and not that much other programming skills.

I simulate a system with particles that undergo Brownian motion.

I want to calculate the diffusion coefficient. To do so I looked at the example DIFFUSE, I am using now the msd method:

compute msd all msd

fix msd all vector 10 c_msd[4]

variable diff equal slope(f_msd)/4/(10*dt)

variable test equal slope(f_msd)

First, everything seemed fine, but when I extended the simulations with more steps, problems appeared.

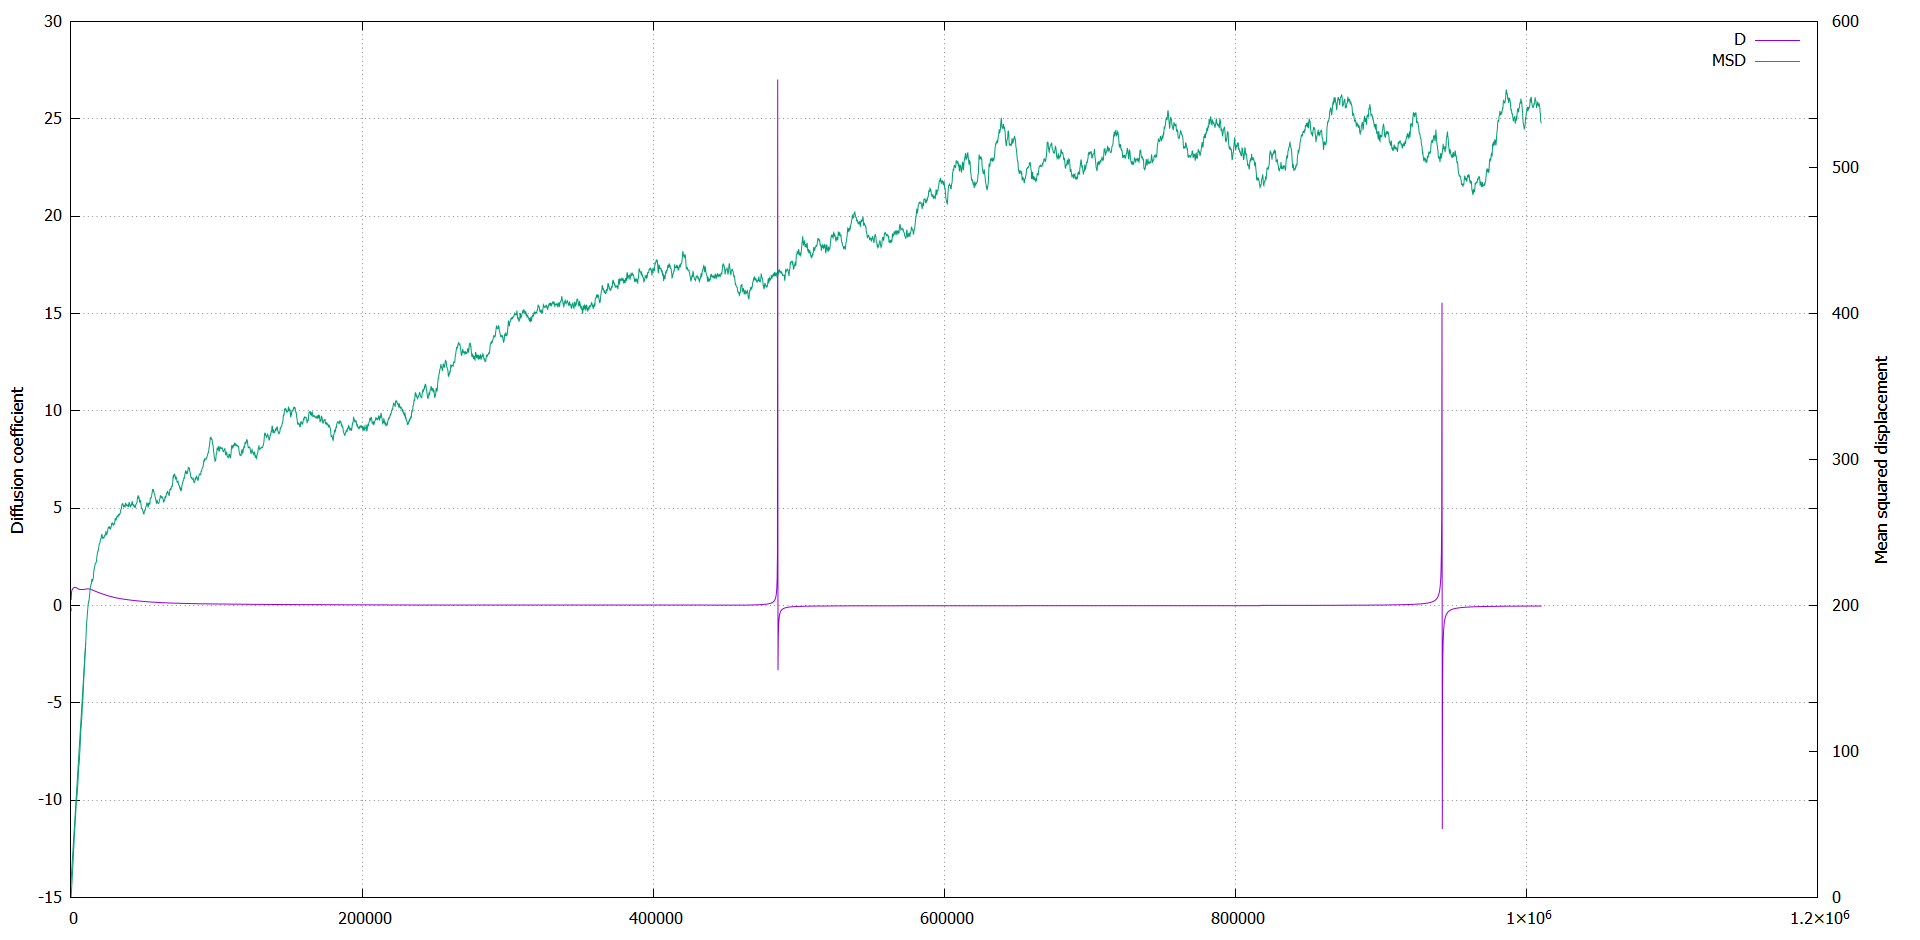
The diffusion coefficient shows unexpected behavior: it gets large peaks at certain timesteps, and after that it is negative.

Then it came back to a positive value, but at some moment again it peaks.

It does so for each simulation, independent of box size, amount of particles and size of timestep.

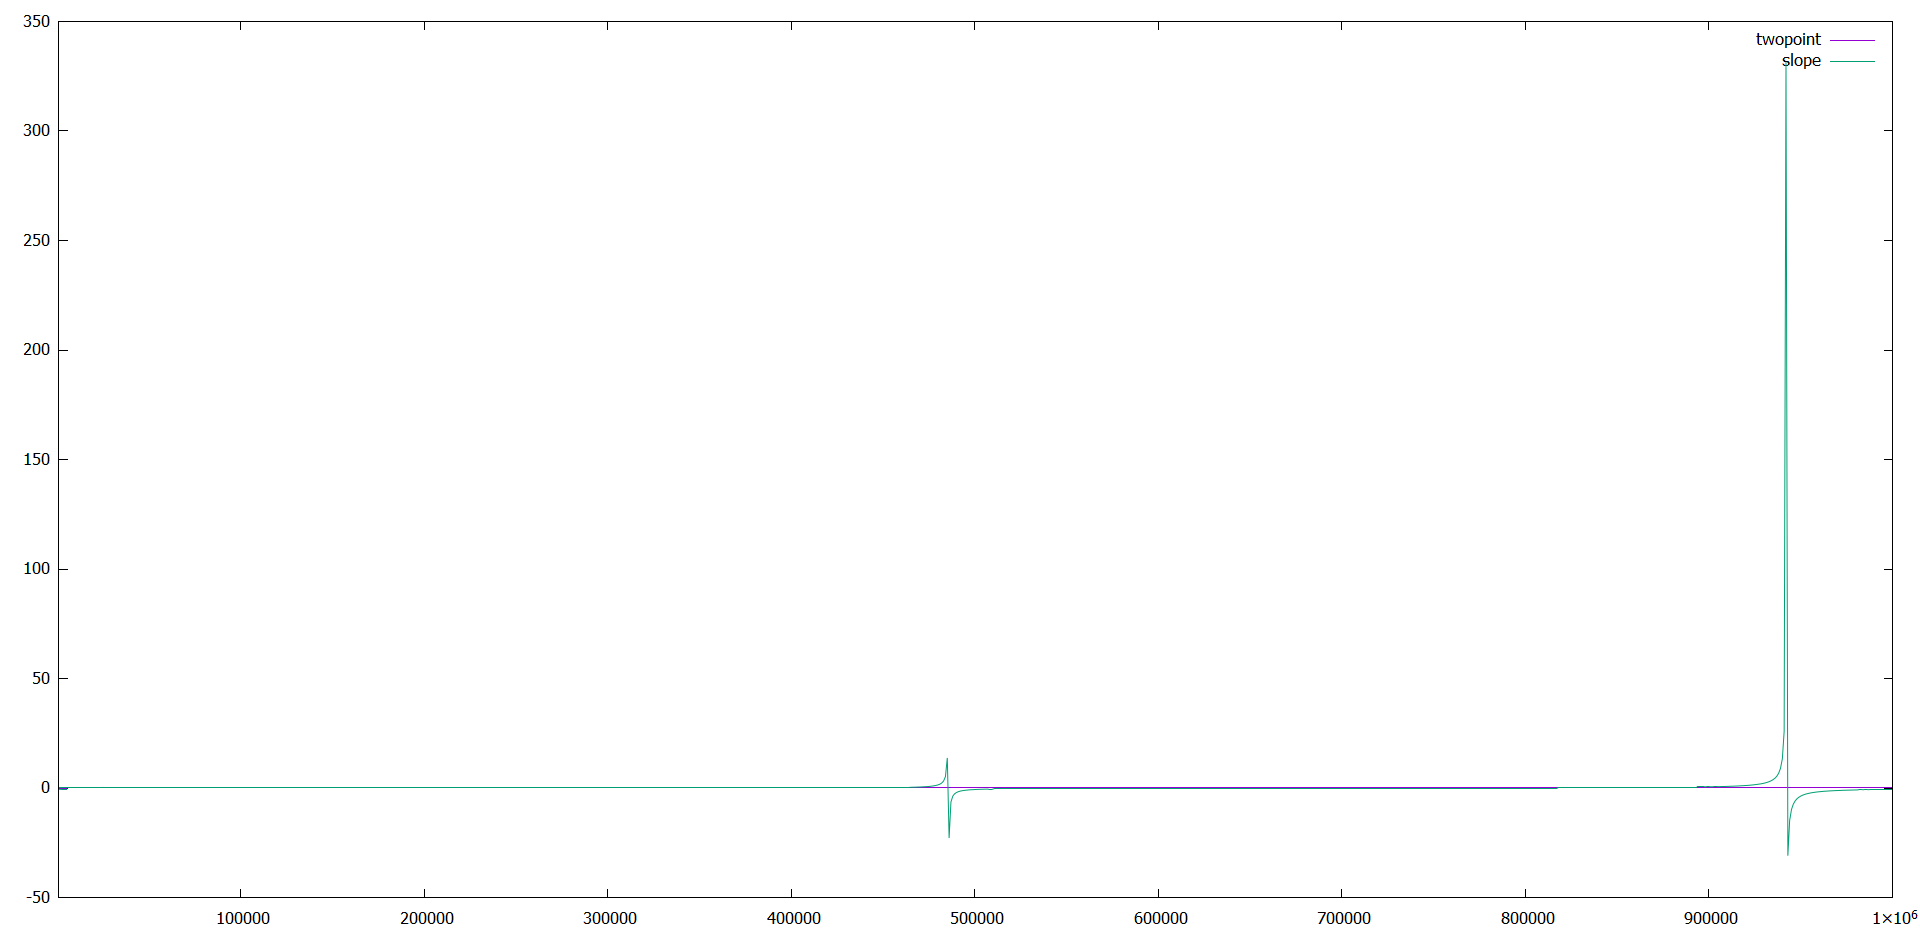
To see if it was a problem of my dynamics, I run the example in.msd.2d, except that I did a million steps instead of 100 K.

In the results, the same behavior appeared.

It seems to be a problem in slope(x), since the data of the msd is fine.

To check that, I plotted pure slope(f_msd), without dividing or multiplying it and indeed it gave the weird behavior.

Is this a bug or is there something I am missing?

I use the LAMMPS version of 3Mar2020

I added a plot of my own data (MSD_D.png), and a plot of the example run for million steps.

Thanks in advance,

Hanneke

MSD_D.png

exampleDIFFUSEmsd.png

It seems to be a problem in slope(x), since the data of the msd is fine.

It’s possible there is some issue with the slope() function or more
likely the way that the vector is accumulated for long periods of time.
To debug that we would need a simple-as-possible input script
for a small problem that runs as-quick-as-possilbe to illustrate
the problem.

But just saving the MSD values to a file (e.g. via fix ave/time) and
post-processing them to compute a slope yourself is generally
a better way to do this calculation. Then you can plot them yourself,
see which portion of the curve has linear slope, etc

Steve

It seems to be a problem in slope(x), since the data of the msd is fine.

It’s possible there is some issue with the slope() function or more
likely the way that the vector is accumulated for long periods of time.
To debug that we would need a simple-as-possible input script
for a small problem that runs as-quick-as-possilbe to illustrate
the problem.

there are integer overflows in the slope() function.
the change in this commit addresses that.
https://github.com/lammps/lammps/pull/2205/commits/307f54611f0b5746ee7487ecbd26bb714ad1df11

But just saving the MSD values to a file (e.g. via fix ave/time) and
post-processing them to compute a slope yourself is generally
a better way to do this calculation. Then you can plot them yourself,
see which portion of the curve has linear slope, etc

yes. including the first part of the MSD curve will add an error to the computed slope, since Einstein relation only holds in the long-time limit.
also, one usually gets a lower statistical error by restarting the MSD calculation multiple times and averaging over the individual graphs.
when also computing the standard deviation for those, you can also get a much better estimate for the statistical error.

axel.

Good find and fix Axel.

Steve