I am investigating the melting of small sodium clusters. My goal is to show the phase transition from solid to liquid state and show that this transition occurs not abruptly in the single point temperature Tc, but smoothly and in some temperature range instead. Though there may be several ways to do so, I found that for metal crystal, only the voro++ package with all it limitations can help me to plot data I need.
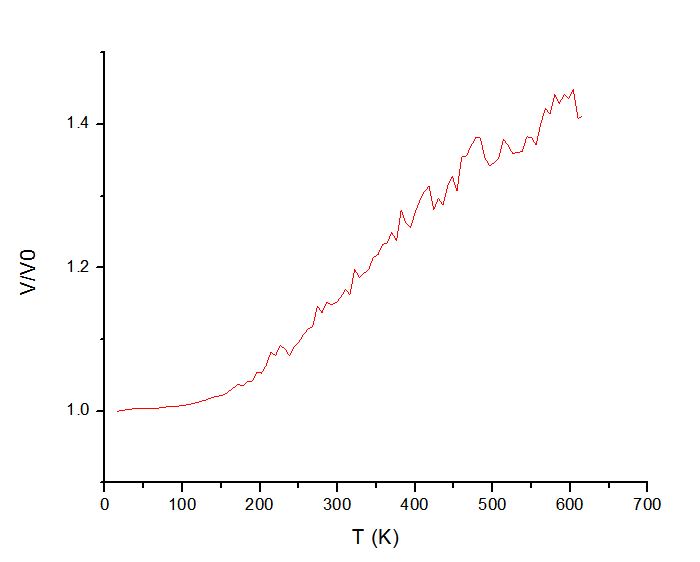
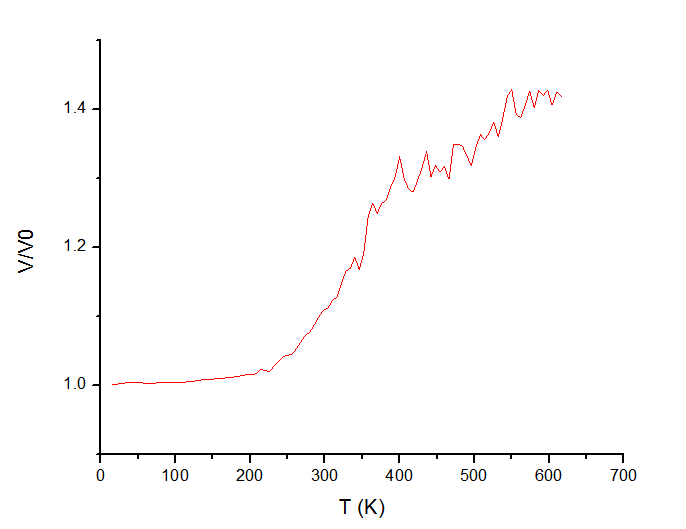
The problem is that the results I obtained depend on choice of Tdamp parameter in fix/nvt command. Specifically, I observe significant change in shape of curve and in melting temperatures range when I vary Tdamp from 0.1 to 0.3 (see graphs in attachments). For instance, with 0.1 value there is no any clear phase transition, whereas with 0.3 value we have some blurred “jump”.
From literature and previous treads (http://lammps.sandia.gov/threads/msg29372.html) I figured out that Tdamp is some kind of “mass” parameter, which is included in Nose-Hoover equations and controls “speed” of equilibration. Since temperature range of PT and curve behavior are crucially important for my study of melting process, could anyone tell me how can I determine which value of Tdamp is “right” for my system?
Clues, suggestions, literature, anything will be helpful.
Thank you for your time!
I am investigating the melting of small sodium clusters. My goal is to
show the phase transition from solid to liquid state and show that this
transition occurs not abruptly in the single point temperature Tc, but
smoothly and in some temperature range instead. Though there may be several
ways to do so, I found that for metal crystal, only the voro++ package with
all it limitations can help me to plot data I need.
The problem is that the results I obtained depend on choice of Tdamp
parameter in fix/nvt command. Specifically, I observe significant change in
shape of curve and in melting temperatures range when I vary Tdamp from 0.1
to 0.3 (see graphs in attachments). For instance, with 0.1 value there is
no any clear phase transition, whereas with 0.3 value we have some blurred
"jump".
From literature and previous treads ( LAMMPS Molecular Dynamics Simulator) I figured out that Tdamp
is some kind of "mass" parameter, which is included in Nose-Hoover
equations and controls "speed" of equilibration. Since temperature range of
PT and curve behavior are crucially important for my study of melting
process, could anyone tell me how can I determine which value of Tdamp is
"right" for my system?
i think you are overlooking some more fundamental issues at hand here.
you are talking about small clusters, so i assume that those clusters are
of the actual size that you are interested in. that would in turn mean that
we do not have to worry about finite size effects (as would be the case
when looking at a bulk system). so far for the good news, but the question
now is, how physical is the transfer of kinetic energy to your system
through an algorithm that was *designed* to reproduce the NVT ensemble of a
_bulk system in equilibrium_. your clusters however, are not a bulk system,
but are just items that are sitting on top of a surface or embedded into
some medium (solvent). in both cases, the - in my personal opinion - only
physically meaningful approach would be to simulate the clusters with fix
nve, i.e. plain time integration with no manipulation at all. transfer of
kinetic energy with the environment should be solely through the natural
collision processes. if you want to be very careful, i would avoid
thermalizing the particles in direct contact as well, but only thermalize
some farther away parts where the thermostat algorithm would then represent
the exchange of kinetic energy with the (not directly simulated) bulk.
while you are discussing the impact of the damping parameter, which indeed
controls effectively the frequency of the additional "chained" degrees of
freedom that represent the bulk system in the nose-hoover chain thermostat
algorithm, but there is no mentioning of the impact of the rate at which
you change the temperature. similarly, if you change the kind of thermostat
algorithm, you may see different results as well, as dissipative
thermostats are much more effective in transferring larger quantities of
heat.
in conclusion, i think that using a thermostat on the clusters per se may
not be a very helpful approach to generate simulation data that has
relations to measurable data or processes than are happening under physical
conditions. and it is quite to be expected that choice of thermostat
algorithm, the relaxation constant and the heating rate all will have some
degree of impact on the results.
You are right, the size of clusters normally do not exceed 3-4nm and have 2000-3000 atoms. Moreover, as you noticed, they confined in some porous matrix indeed.
Following your conclusion, fix/nve command is the only way I can get meaningful data for small solid cluster.
Thank you a lot!