I have run the EAM benchmark (https://www.lammps.org/bench.html#eam) on my local workstation, both on GPU and CPU.
The number of neighbours on GPU is always zero when setting neigh yes:
Total # of neighbors = 0
Ave neighs/atom = 0
Neighbor list builds = 140
Dangerous builds = 1
Total wall time: 0:00:01
but even when running with neigh no I get a substantial difference between GPU and CPU. On GPU:
Total # of neighbors = 2416250
Ave neighs/atom = 75.507812
Neighbor list builds = 140
Dangerous builds = 1
Total wall time: 0:00:09
on CPU (single core):
Total # of neighbors = 1208113
Ave neighs/atom = 37.753531
Neighbor list builds = 140
Dangerous builds = 1
Total wall time: 0:00:25
on CPU (56 cores):
Total # of neighbors = 1208113
Ave neighs/atom = 37.753531
Neighbor list builds = 140
Dangerous builds = 1
Total wall time: 0:00:00
This is my input script:
# bulk Cu lattice

# Remove when running on CPU
package 	gpu 1 neigh no

variable        x index 1
variable        y index 1
variable        z index 1

variable        xx equal 20*$x
variable        yy equal 20*$y
variable        zz equal 20*$z

units           metal
atom_style      atomic

lattice         fcc 3.615
region          box block 0 ${xx} 0 ${yy} 0 ${zz}
create_box      1 box
create_atoms    1 box

# Switch to 'pair_style eam' on CPU
pair_style      eam/gpu
pair_coeff      1 1 Cu_u3.eam

velocity        all create 1600.0 376847 loop geom

neighbor        1.0 bin
neigh_modify    every 1 delay 5 check yes

fix             1 all nve

timestep        0.005
thermo          50

run             1000
Yes. This is expected. That information is not collected when building the neighbor lists on the GPU.
Yes. That is also expected. When running on the GPU a full neighbor list is created, i.e. every pair is listed twice (as i-j and j-i) while the CPU version of the pair style uses a half neighbor list, i.e. every pair is listed only once. The reason for that is that with multi-threading (and GPU acceleration is effectively multi-threading at an extreme scale), the update of the forces has a race condition with a half-neighbor list, which creates significant overhead with the number of threads when trying to avoid that, while with a full neighbor list this does not happen and so even if the full neighbor list creates twice the amount of work, it can be much better parallelized with less overhead and for a large number of threads, this is much faster and shows much better strong scaling behavior.
There is no bug. This is just how the different pair style variants work with the different settings.
Ah, I see. So with neigh yes is simply an output ‘issue’, otherwise it’s essentially algorithmic optimisation.
I was wondering if it was a bug of if there was any difference in behaviour since I am getting inconsistent results between GPU and CPU on another run (still EAM but a slightly different system), and the neighbour list was the main suspect (based on my experience with MD and what I have found in the documentation).
Thank you very much for the clarification.
What do you mean by “inconsistent”?
Please note, that you cannot expect identical trajectories, even when compiling the GPU package in full double precision, due to floating-point math limitations (the exact forces depend on the order in which forces are summed up). This would also happen if you use a different number of processors on the CPU. With mixed precision GPU kernels, this exponential divergence happens much faster, even.
Yes, indeed. Apparently I was just a bit unlucky as I was unknowingly very close to the phase transition temperature, and a slight underestimate of the potential energy in mixed precision led to a huge change in the RDF. Far from the critical point I see very similar result.
Quick update: it turns out the cause of the mismatch was not the floating point precision, but rather the GPU library.
I built with OpenCL instead of CUDA, by mistake. After building with CUDA and running again I don’t see any substantial difference in energies anymore.
This should not happen. Can you post a minimal input where you can reproduce this difference
and post it here? @ndtrung may be able to help tracking this down.
Hi, I can try. The only problem is that for some reson I cannot run with OpenCL anymore, as I incur in this error: OpenCL error when running Lammps with gpu
I’ll re-build with OpenCL (hoping it will make te issue disappear) and run the EAM benchmark again.
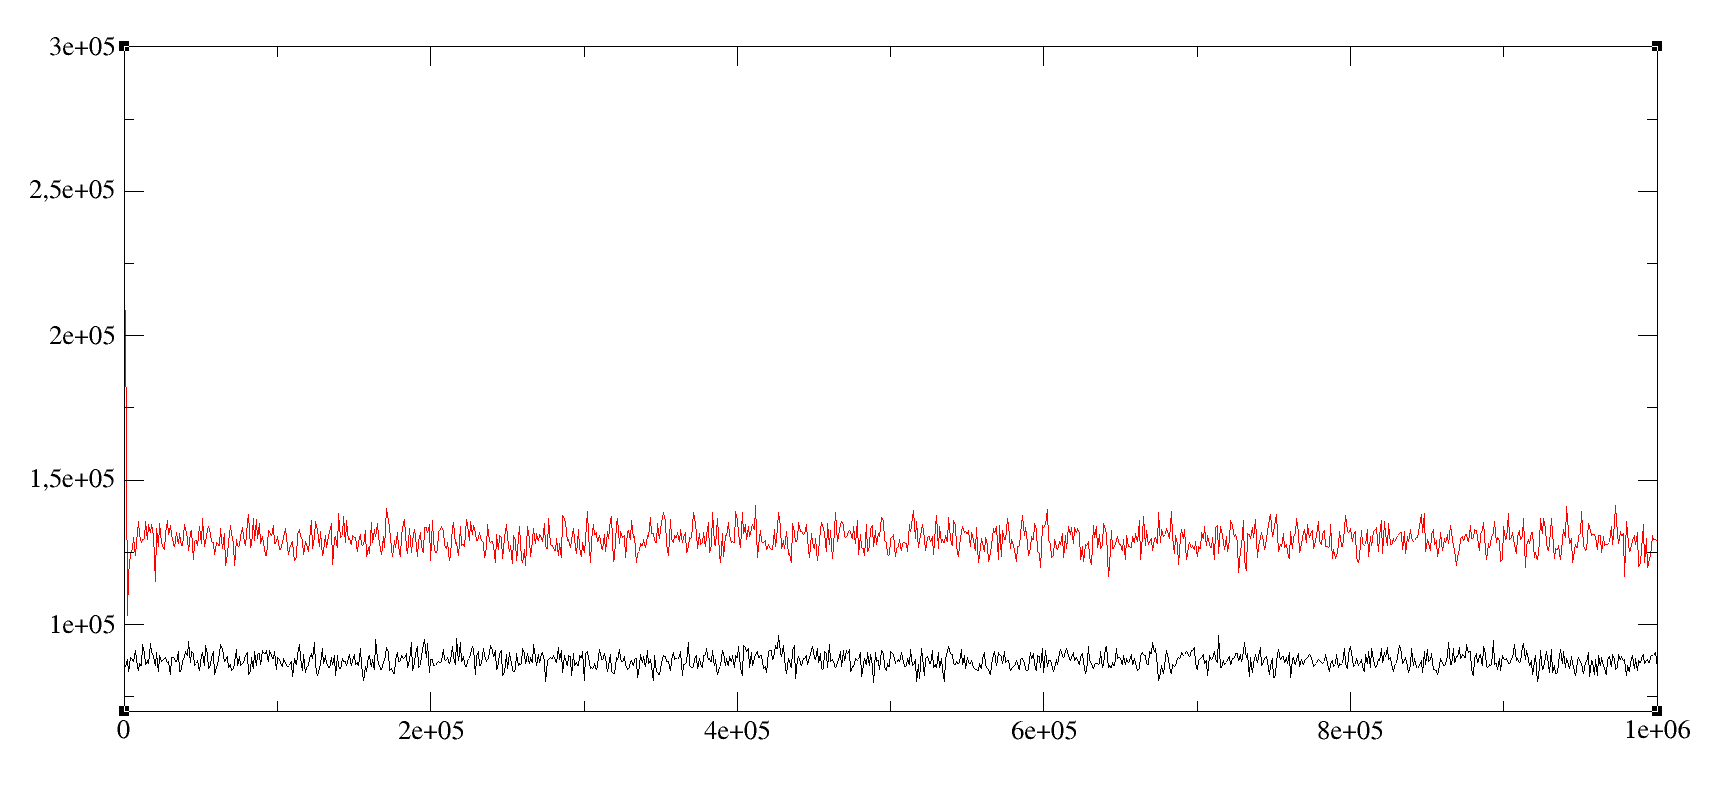
I am in a hurry so I forgot to put labels: y-axis is surface tension [bar*Å], x-axis is the frame (multiply by 0.001 to get the time in ps), red is OpenCl and black is CUDA.
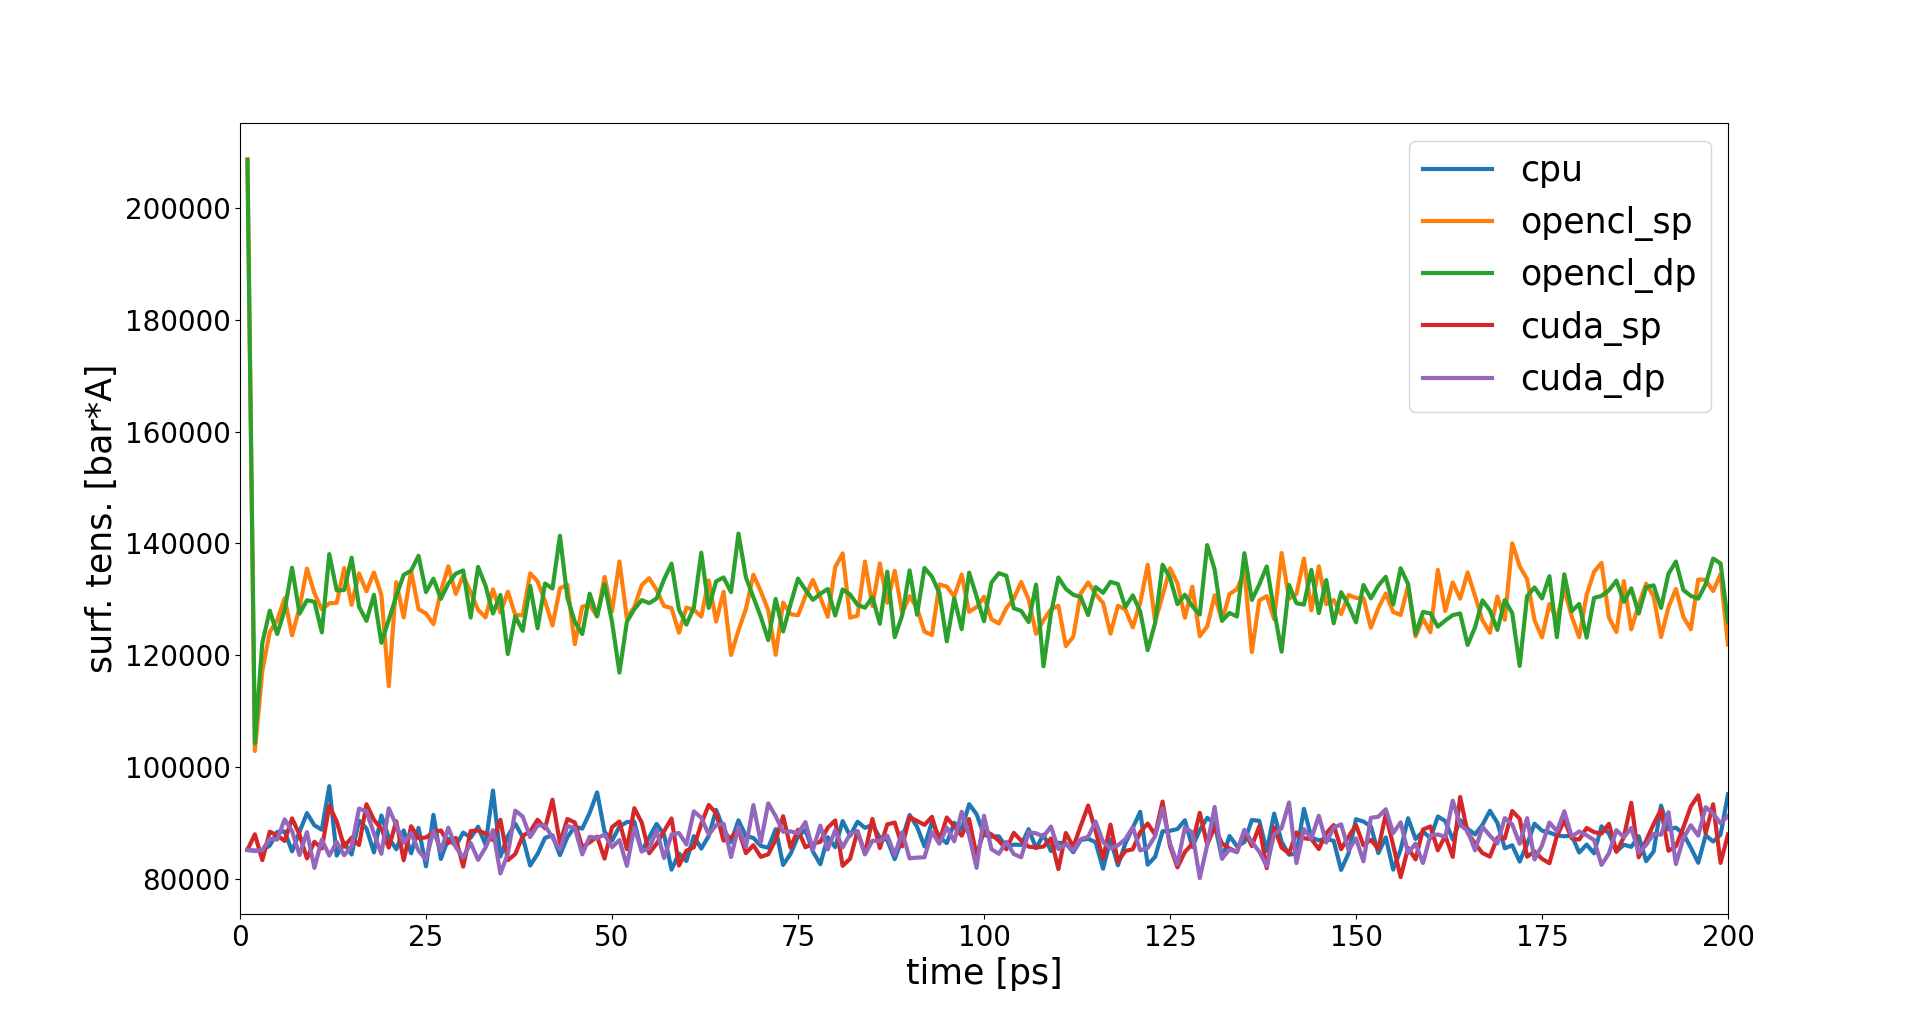
When I ran your first input script with CUDA and OpenCL builds in double precision, the thermo numbers all match up (given the numerical format) with the CPU-only runs within 1000 steps. Could you also build CUDA and OpenCL with double precision (-DGPU_PREC=double) and compare the surface tension with the CPU-only run again?
The double precision builds would be helpful for debugging purposes. I am wondering if the difference in the surface tension comes from the precision of the builds, or something else, and why pressures jump to different values here. Could you also add pxx, pyy and pzz to the thermo output? Also, how substantial the performance diff between mixed to double precision builds is informative, too. Thanks!
Pressure components are very noisy and I cannot understand which one is causing the mismatch from the thermo output alone. But in any case it seems to be a OpenCL problem, not a mixed vs. double precision problem.
I can go on and analyse the single components of the pressure tensor, but frankly I am not planning to run with OpenCL anyway in the future, so…