Unlike the documentation of the individual commands in the manual which is rather dry and focused on describing all keywords and options, I would like this to be more driven by topics and examples and thus more practical.
For that purpose, I want to invite you to help me making it as useful as possible. Of course, I have been focusing thus far on discussing the recent additions to LAMMPS’ graphics capabilities, but I don’t want it to be limited to that. This is where your input will be incredibly valuable. I am looking for both, requests for added discussion topics, but also examples and recommendations for creating particularly good looking visualizations. In my experience the difference between an “ok” visualization and an impressive one is often just an example showing and explaining(!) how to use some functionality that is not enabled by default. Many times, just a few small changes (or “hacks”) can make a big difference and that in turn can boost the visibility of your research.
So please let me know:
What is your preferred visualization tool for LAMMPS simulations? and what do you like about it? If you use multiple tools, please let me know when you prefer which one. I hope that this kind of information can be condensed into some recommendations for which tools to use for what purpose.
What kind of visualization is the most challenging? Where are you struggling the most to get satisfactory results? If you have them, please share your most useful “hacks” for your favorite visualization tool(s).
Specifically about LAMMPS and the dump image (and by extension dump movie) command: is there something that you are missing? Are there features that you have difficulties to use or understand? Is there something that you always wondered how it could be done?
I am attaching a PDF of the current draft. Please share any comments, corrections, or suggestions. Don’t hesitate to ask if you have questions about some details.
If you prefer not to discuss this in a public forum, you can contact me at my personal email address. Please make sure you mention this post, so your email does not get categorized as spam or junk.
Extremely interesting topic to me as I’ve struggled for a long time to find a good fit to my needs in term of 3d md visualization. As I’m already very picky on 2d plots and oscillate between gnuplot and matplotlib, I often go back and forth between tools. But to answer your questions:
There are two tools that I really like to visualize LAMMPS trajectories which are OVITO and LAMMPS itself. The former was very convenient for complicated workflows with regard to atoms selections, coloring, the lighting and most of all, adding element (text, but also arrows, color scale bars etc.), up until I reached a point where I needed something else and had to redo stuff in GIMP. Figure 1 and 2 of this paper are examples in which the colored surfaces where done from dump files with OVITO.[1][2] I don’t think I would have been able to produce such figures with LAMMPS at the moment. I tried making an “arrow” image dump lib but it rendered like shit and I deleted it. Apart from that I think the most useful computations OVITO can do for figure rendering can also be done with LAMMPS with a few exception like polyhedral template matching or trajectory lines.[3] With the new commands you added like isosurface computation, this is even more the case.
The most challenging visualization aspect to me is finding the good transparency settings when producing surfaces or an object you want to see through. There is often a very thin range of settings in which you can both see both of the information. One might say that having trouble making the figure is a sign the figure is not well thought, but sometimes the software limitation also get in the way.[4]
Finally concerning LAMMPS capabilities I think that once you have wrapped your head around how it works, it is pretty straightforward to use with one exception: camera’s position. I think that having to write down through text only the camera position and displacement is the most painful part. But I see no work around except trial and error of your script until things work well. I tend to note the coordinates I find the most useful somewhere for particular systems.
That’s what comes to mind reading your questions. In the past I’ve also seen people programming pov-ray scripts from molecular dynamics simulation analysis which produces beautiful visuals but have a very high learning curve. I know that some people also use Blender for their movies but this is not something I’ve tried myself.
The only figures I can take credits for here are 1, 2 8 and 9. I didn’t make the others, but I produced some of the data they are made from. ↩︎
While OVITO is stills a very powerful tool and got better in the last years, one of the updates from a couple years back removed the possibility to make multiple pipelines in the free version. This makes it less useful without a license and killed any purpose of the free version IMHO. I wouldn’t blame the developers for this choice however. Just stating the fact. ↩︎
The former would “simply require” a dedicated compute command equivalent to compute cna/atom. ↩︎
In general, computing and visualizing surfaces have proven to be complicated for me in the past actually. ↩︎
It is not my goal to replace OVITO in its full glory (or VMD for that matter), but rather to make things possible that require access to data that is directly available in LAMMPS and to get to a “reasonable” output with less effort. But any special recommendations or scripts or special tricks for making nice visualizations with either OVITO or VMD would be in scope for the visualization howto. Or a recommendation on when to use what, i.e. where are the individual strengths.
as for your first point. Adding text and objects like arrows or images to visualizations, I think that is covered now. The idea of a colorscale bar is something that would fit well into fix graphics/labels since it is essentially an image with text.
colored surfaces is something that I would have to think about, since that is currently not easily supported by the available interface. The granularity would be limited to coloring individual triangles (or other objects). so to get finer color transitions, one would have to refine the triangle meshes (I have some code for that), but currently triangles have to be colored either all in a single color or by the same colors as the atom types. I have also been thinking of using different ways to construct a surface, e.g. Delauney triangulation ( https://www.ks.uiuc.edu/Research/vmd/script_library/scripts/delaunay_triangulate/ ). Right now the isosurface is constructed by first translating data to a 3d grid with some kind of Gaussian spreading. I have been thinking of also processing 2d or 3d binned per-chunk data.
I have to look into what it would take to implement polyhedral template matching
I’ve looked at and thought about trajectory lines as they are available in OVITO. I think we can actually improve on that by adding an option to apply some sliding window averaging (or even better some sliding window polynomial filtering) to get less noisy lines. We can represent them not just as colored pixels but also as connected cylinders or cones. In the latter case one could make the diameter and color dependent on some property (e.g. velocity or charge or “curvature” etc.). I also would like it if there was an option to determine the maximum length and perhaps let the trail created by a particle fade into transparency. So this is something that could be added - at least in the simplest form - with moderate effort.
transparency is a tricky thing. over the years I have learned that in most cases where you would want to use transparency, especially on atoms and bonds, this is not what you want. It is probably better looking with a rasterizer like LAMMPS currently uses than with real OpenGL shading. In the rasterizer, you don’t “see” objects at the same transparency level that obscure each other with a shader you do and that makes the latter kind of images less useful. There are two things that I found that helps. Replace representing transparent atoms with transparent isosurfaces and use what is called angle-dependent transparency. That is more like soap bubbles or blown glass objects look like. That means the surface is 99% transparent when it is (almost) parallel to the camera and only a few percent transparent when it is (almost) orthogonal to the camera. VMD does support that through its material settings (I am responsible for that, since I asked for this feature and showed images to John Stone created with a rasterizer that would create beautiful images of atomic orbitals this way), I would assume OVITO should be capable to do the same since it uses the same kind of technology (OpenGL).
I agree about the trial and error approach to find good settings, but using LAMMPS-GUI can make that approach quite efficient. You can draft the visualization in a quasi-interactive way in the snapshot image viewer since it will re-render anything after you click on buttons and it records the necessary command lines. These can be transferred into the cut-n-paste buffer and then inserted into the input. Then, you can run, stop, and re-run the input very rapidly using keyboard shortcuts and LAMMPS-GUI will automatically display generated images in the slideshow viewer. So you can refine the visualization. Stop the run, if it doesn’t go the way you like. Change it in the editor, rerun, and rinse and repeat. I’ve used that technique a lot during the last six weeks or so. In fact, I felt like thanking Steve for suggesting this feature to me since it made testing the new stuff much more efficient than using this with a console, an editor and an image viewer. I have added a paragraph along those lines to the visualization howto already (it may not be in the attached PDF, I am not sure whether I added this before or after my post here).
I have been thinking along those lines myself. Since the rasterizer in the LAMMPS image class works on two levels: dump image requests the display of primitives like triangles, spheres, or cylinders of a given color with a given transparency at the given location with with provide diamaters or edges and then those functions translate this into pixels which are then merged into the image buffer per MPI process which are then merged globally and output to an image file. It would be a rather straightforward approach to make Image a base class and then have the current rasterizer as one derived class, but there could be other derived classes that would instead create scene files for the likes of Tachyon, POVray, Blender and so on. The primitives that are supported by LAMMPS are a subset of what is available to those raytracing tools and you would mostly need another set of options to match atom or bond types with materials. It may also be possible to create such a back end for EGL and then use OpenGL shaders and GPU acceleration for creating images. Of course, this will require some significant refactoring, but I think the principal architecture is there. I have written some “emulation” classes which use the existing primitives to emulate items that are not present, like ellipsoids, (truncated) cones and cylinders capped with a circle. or surfaces with cutting planes at the edges of the simulation box. So those emulations may need to be integrated into the rasterizer image class, so the corresponding primitives could be added to the API and then the more capable back ends could use their own primitives. But I don’t want to get ahead of myself.
The most complex processing that I have done so far is using the python command to use a python function to retrieve data from LAMMPS through the python module and then create an image by regularly calling this function using fix python/invoke with matplotlib and then import that image as a pixmap, apply transparency and overlay it to a visualization. So in many ways, what is the limitation is also a question of creativity and getting the right inspiration.
I think that I would give the trajectory lines and the colorscale bar a try to add after the current batch of changes are merged. If you want, I can submit a draft pull request if I have some prototype code implemented and we can discuss further.
My favorite visualization tool is OVITO. I know some people prefer VMD, but I can’t really accept it’s GUI style which comes from like 40 years ago… What OVITO attracts me include the simple yet beautiful UI, responsive developers (I reported quite a few bugs in the OVITO sub-forum, and usually got response in 1 day and it is fixed in the next release), and the modifier-stack logic (probably because I learnt 3ds max a long time ago).
Regarding LAMMPS itself, I have three things to comment on:
I have almost never considered LAMMPS as a visualization tool, probably because it was listed in the “non-features“ of LAMMPS when I entered this field. Now that page includes the word “Originally”, but I don’t think many people actively check that, so they would not even be aware of this feature. I don’t think this situation must be changed (external tools work just fine), but I think I should mention it.
I hope there are instructions on how to visualize existing trajectories. I don’t think it’s a thing to run production simulations with LAMMPS GUI; instead the usual workflow (for me) is to run simulations on HPC → download trajectories → do visualizations locally. I always prefer having the raw trajectories if possible; so when I want to do some additional analysis I don’t need to run the whole MD again.
related to point 2, I think the unique advantage of LAMMPS visualization is to visualize without downloading (or even creating) the trajectory files, which is helpful when the system is very large. This should be mentioned somewhere.
It is more like 30 years ago. I was there and had access to SGI workstations (or rather Silicon Graphics) that pioneered the kind of graphics and user interface.
VMD and OVITO cater to overlapping but mostly different audiences. VMD requires trajectories where the number of particles and the bond topology is constant, but then it can be very fast and handle huge systems efficiently. OVITO is far more flexible, better adapted to LAMMPS and more in tune with the needs of people in the “materials science” domain rather than “molecular simulations and soft matter”.
It is good to have choices, even if you sometimes do not understand. (Example: it is a mystery to me now, how somebody can work efficiently with visual studio code but it would not be as popular as it is without that. But people were telling me the same thing about Emacs back in the time. Some would even joke that it was a acronym for “Eight Megabytes And Constantly Swapping”. Eight megabytes was a lot of RAM in those days. )
This is where the “rerun” command comes in. That also applies to additional analysis steps that were omitted during simulation.
You may be confusing things here. LAMMPS-GUI and dump image in LAMMPS are two separate things. Now, LAMMPS-GUI will benefit from the additional graphics capabilities, once I have programmed a suitable interface into it. and also LAMMPS-GUI makes incrementally testing and improving a visualization with LAMMPS and dump image easier and faster.
I expect this to be true for the majority of LAMMPS users, but I have seen questions here in the forum that suggests that there also are applications where running LAMMPS through LAMMPS-GUI on a desktop or laptop computer is sufficient. CPUs have become far more capable compared to the time when LAMMPS was invented. I notice this on a daily basis when I can test and debug simulation input decks on a mini-PC with a laptop CPU at home that would a few years ago required me to run on an HPC cluster. That said, in most cases, you would probably still prefer to use a graphical front end which does not integrate with LAMMPS as tightly so that you can terminate the GUI without terminating the calculation. I see LAMMPS-GUI primarily as a tool for learning and testing/debugging and prototyping more complex simulations.
Here is a fun fact: this was not planned at all. We were just confronted with the situation that our
previous scheme for having a uniform environment to teach people how to use LAMMPS (i.e. using virtual machines) got killed by Apple switching away from Intel CPUs. This is how it got started, but then it developed a bit of a life of its own. It has become a testbed and playground for what can be done with the LAMMPS library interface, a motivation to improve the introspection capabilities in the LAMMPS and now the built in graphics abilities. It motivated a thread-safe way to access simulation status information from a running simulation and to smoothly start and stop it. It also allowed to find and fix a whole lot of bugs that would not show up when you just run the LAMMPS executable, but could become a problem for users that run high-throughput calculations through the LAMMPS python module.
Lesson: you never know where an idea can take you.
I must be a very old soul, because I like VMD. Its primitive GUI is perfectly clear and sensible, and it’s the most straightforward thing for me to hammer out by muscle memory into the CLI:
topo readlammpsdata init.data
topo guessatom lammps data
display perspective orthographic
mol addfile dump.xtc
animate goto 1
pbc join fragment -now
pbc unwrap -first now -last last
pbc wrap -first now -last last -compound fragment
The atom selection strings are intuitive, powerful, and reusable in MDAnalysis, and the plugin ecosystem is mature.
I can’t think of a lot to add to a general visualisation guide than simply “Follow the sequence above. You’ll be alright.”
FYI, most of the pending new stuff is now in the development version of LAMMPS.
You can already see the the expanded Howto page in the “latest” channel of the online documentation:
@Germain FYI, I have created a feature request issue in the LAMMPS repository to collect ideas and suggestions [Feature Request] Future additions to the GRAPHICS package · Issue #4844 · lammps/lammps · GitHub
Feel free to add a comment or edit it in case I missed or misunderstood something or you are getting an additional idea. There is some interesting stuff already that I look forward to work on. Since this is in a way some kind of “vanity project” for me, it mostly matters whether it is interesting and fun to implement or to figure out how to implement it.
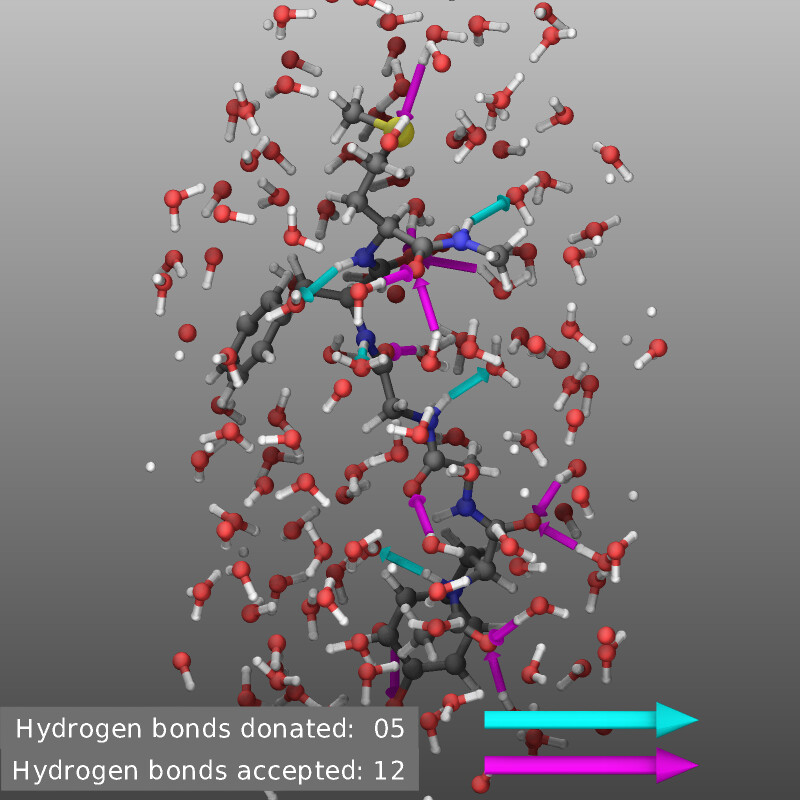
… and another graphics hack to do something that would be difficult to do with an external visualization tool. This is highlighting atoms involved in a reaction modeled by fix bond/react:
@Germain Here is a demo of the code that I just put together. Most of the hard work is actually done by a compute and two fixes that are managed internally.