Dear All,
I’m working on thermal conductivity simulation of nanofluids using NEMD (fix ehex).
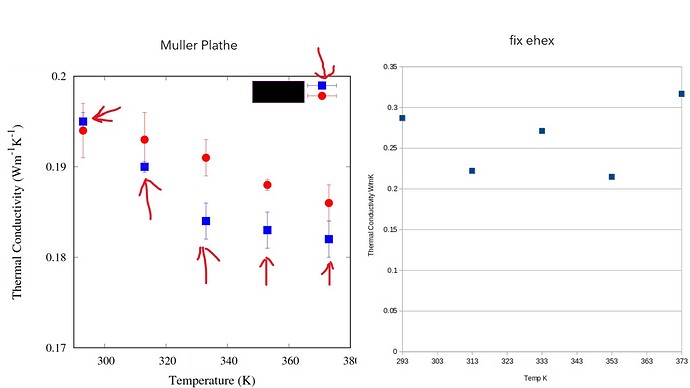
My results at different temperatures vary/deviate/not same trend as results obtained by muller-plathe method. Figure1 attached.
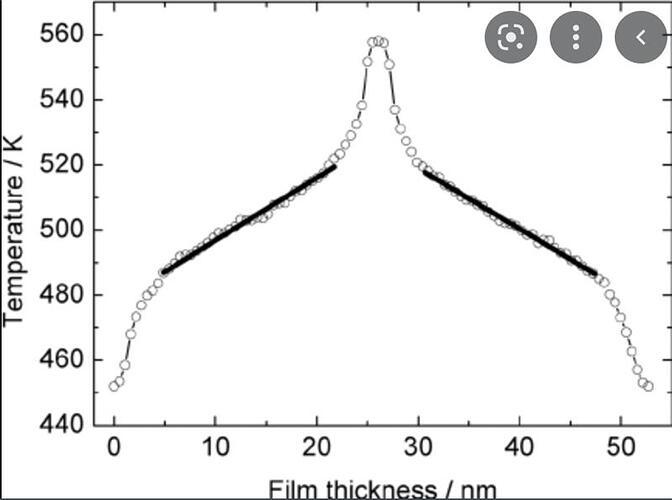
I would like to check whether the temperature gradient becomes linear or not. Create a graph similar to figure 2 attached.
Any suggestions or references would be appreciated.

