Dear LAMMPS users and developers,
High time to try start another open ended discussion. This time I would like to discuss about some recently added features in LAMMPS. Support to creating outputs in YAML format for easy reading and post-processing with python or other script languages. This originally started from discussions on adapting the example files in the LAMMPS distribution for regressions testing.
One of the challenges is to reliably extract only the thermodynamic data for creating a reference and storing and analyzing them efficiently. There is a logfile analyzer tool written in Python as part of Pizza.py that can do the extraction part, but it is rather fragile and not fully compatible with the needs for testing. Based on what was written in the first part of 8.3.8. Output structured data from LAMMPS — LAMMPS documentation the idea arose to add a new thermodynamic output style that does the YAML format automatically. The structure of YAML files also makes it easier to extract only the contents in YAML syntax and skip over contents that are not thermodynamic output.
Another contributing factor was the request to have the option to rename the column headers, especially for computes and fixes, so they will be more descriptive of what data they contain. Combined with some necessary refactoring to modernize the code and get rid of some complexity those changes were all implemented recently.
There are two ways to enable YAML style thermo output. a) Use thermo_style yaml where you get a fixed set of properties similar to the default output, b) Use thermo_style custom followed by thermo_modify line yaml.
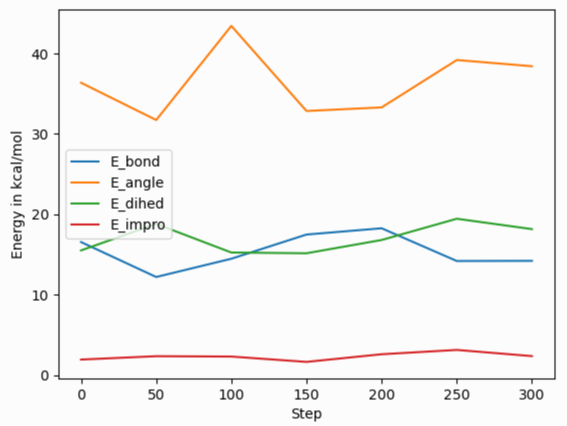
Now extracting and plotting the data is extremely simple in Python when using the pyaml, pandas, and matplotlib modules.
import re, yaml
import pandas as pd
import matplotlib.pyplot as plt
# extract YAML format part from log file
docs = ""
with open("log.lammps") as f:
    for line in f:
        m = re.search(r"^(keywords:.*$|data:$|---$|\.\.\.$|  - \[.*\]$)", line)
        if m: docs += m.group(0) + '\n'
thermo = list(yaml.load_all(docs, Loader=CSafeLoader))
# convert list of list to a pandas data file and plot
df = pd.DataFrame(data=thermo[0]['data'], columns=thermo[0]['keywords'])
fig = df.plot(x='Step', y=['E_bond', 'E_angle', 'E_dihed', 'E_impro'], ylabel='Energy in kcal/mol')
plt.savefig('thermo_bondeng.png')

In combination with the thermo_modify colname option to rename columns, creating a plot of the thermodynamic data in high quality should be very easy. Certainly easier than with the older tools.
In addition, we also now have a dump style yaml that can import data in a similar fashion, and work on fix ave/time and other averaging fixes to support YAML format output has started.
What is most compelling to me about these feature is that this is built entirely on well supported widely used support software (pyyaml, pandas, numpy, matplotlib) and since pandas uses numpy storage underneath it is also very effective and fast for processing large amounts of data.
What do people think about this?
Do you see any other applications that can be built on top of this, or parts of LAMMPS that could benefit from interfacing with YAML format data?
Are there alternatives worth looking into?