Dear All,
I have sent this to the author of the eDPD package as well, but I just wanted to post it here too.Maybe some one can help. Looking at the following code:
units lj
dimension 3
boundary p p p
neighbor 0.2 bin
neigh_modify every 1 delay 0 check yes
atom_style edpd
region edpd block -5 5 -5 5 -3 3 units box
create_box 1 edpd
create_atoms 1 random 1600 276438 NULL
mass 1 1.0
set atom * edpd/temp 1.0
set atom * edpd/cv 1.0E5
pair_style edpd 1.58 9872598
pair_coeff 1 1 18.75 4.5 0.41 1.58 1.41E-5 2.0 1.58
compute mythermo all temp
thermo 100
thermo_modify temp mythermo
thermo_modify flush yes
comm_modify vel yes
velocity all create 1.0 432982 loop local dist gaussian
fix mvv all mvv/edpd 0.5
fix upper all edpd/source cuboid 0.0 2.5 0.0 10.0 5.0 6.0 0.01
fix lower all edpd/source cuboid 0.0 -2.5 0.0 10.0 5.0 6.0 -0.01
timestep 0.01
run 500
reset_timestep 0
compute temp all edpd/temp/atom
compute ccT all chunk/atom bin/1d y 0.0 1.0
fix stat all ave/chunk 1 500 500 ccT c_temp density/number norm sample file t2.profile
run 500
you can see that I am choosing the
upper heat source to be a cube with coordinates (x=0:10, y=2.5:7.5, z=0:6) ,
lower cooling source to be a cube with coordinates (x=0:10, y=-2.5:2.5, z=0:6),
and my box region is: (x=-5:5 ,y=-5:5, z= -3,3)
drawing it in mathematica
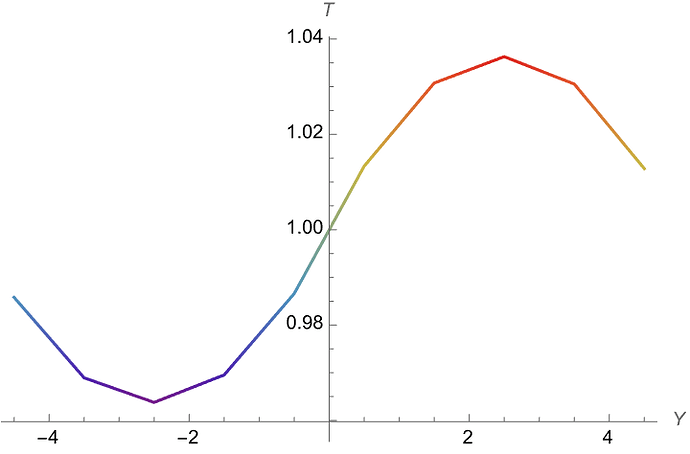
The yellow cube is the heating region, so I would expect to have higher temperature in the left and right side of the box and a cooler region in the middle, but looking at the temperature plot:
we can see that the middle of right half is heating (have higher temperature) and the middle of left half is cooling. Can anybody help me understanding what is going on?
Regards,
Delaram

