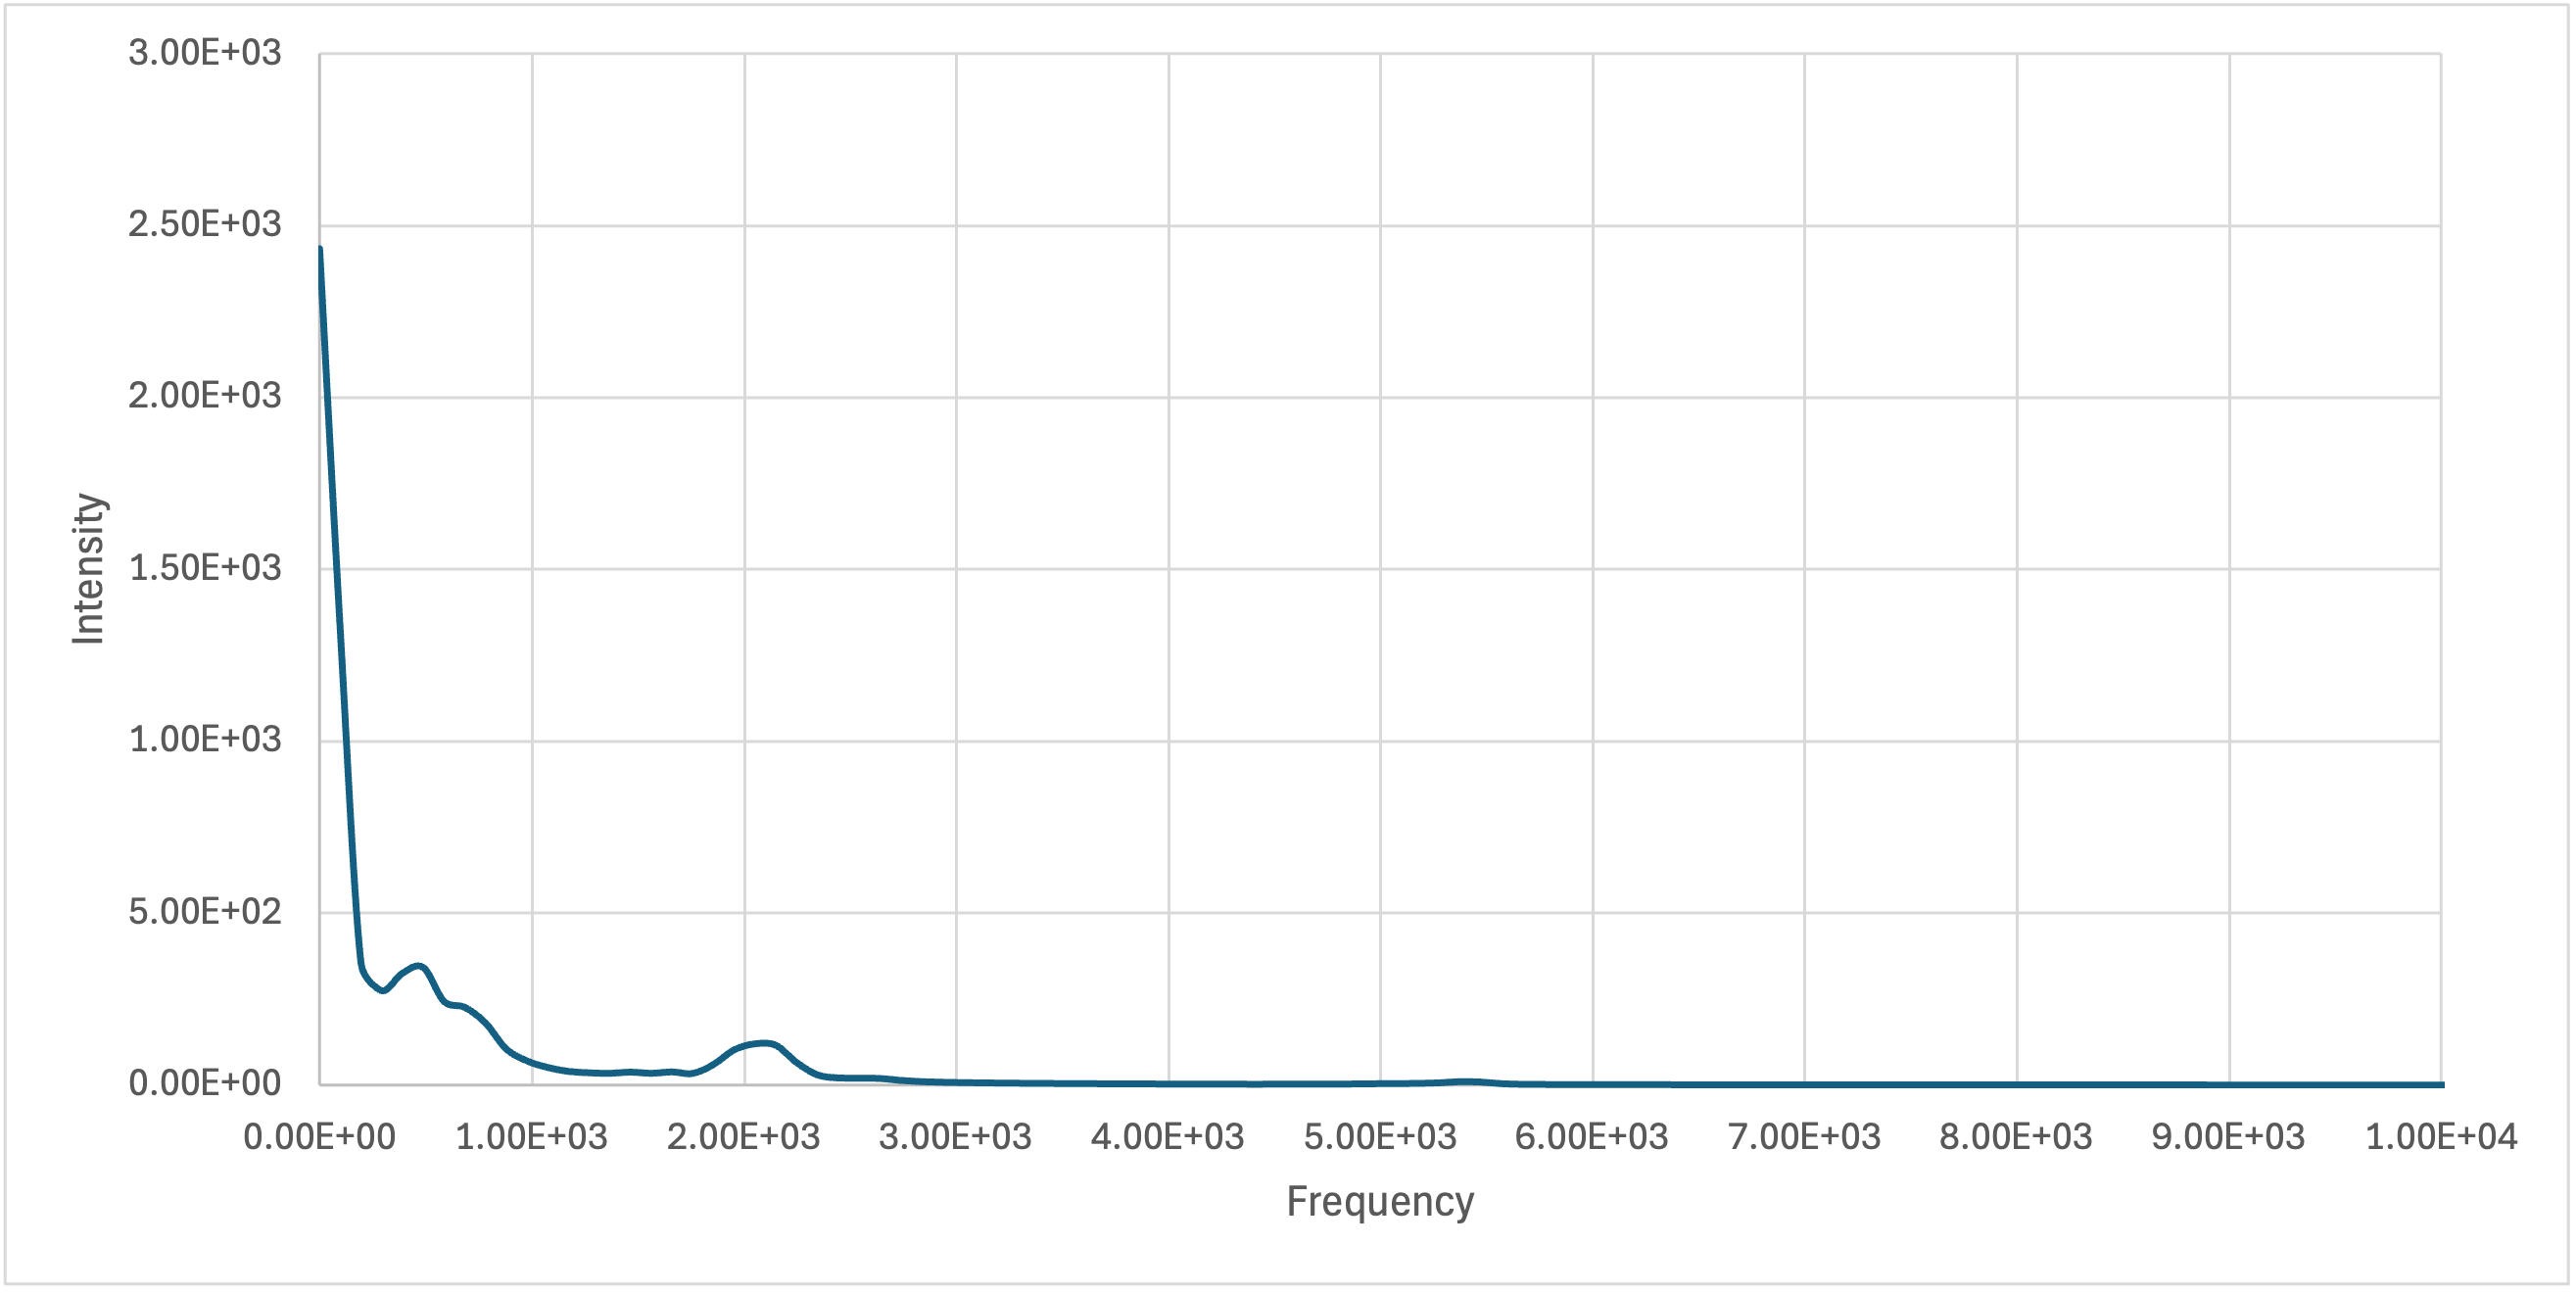
I am trying to get phonon vibrational density of states (VDOS) from LAMMPS dump file. I have tried several approaches, either using LAMMPS commands to get the VACF and convert it into the VDOS with python codes, or using the available codes in web for this purpose. From all of these methods, I am getting a VDOS distribution which does not show zero intensity at zero frequencies.
For getting the trajectory files, I am using NVE with 0.1 time steps and for 200000 run times.
#  This is the control script for LAMMPS.

echo			both

#-------------------------------------------------------------------------------
# Stage 2.1: Initialize LAMMPS run for 3-d periodic
#-------------------------------------------------------------------------------

units			real
boundary		p p p
atom_style		full
#restart 200        restart

pair_style		lj/class2/coul/long 10 15
pair_modify             mix sixthpower
pair_modify		tail yes
bond_style		class2
angle_style		class2
dihedral_style		class2
improper_style		class2
special_bonds           lj 0.0 0.0 1.0 coul 0.0 0.0 1.0

box                     tilt large
read_data		structure.dat
#read_restart	 	structure.dat

include			parameters.dat

neighbor		2.0 bin
neigh_modify		delay 0 every 1 check yes
kspace_style		pppm 0.0001

#-------------------------------------------------------------------------------
# Stage 2.2: Minimization
#-------------------------------------------------------------------------------

#min_style		cg
#min_modify		dmax 0.05 line quadratic
#reset_timestep		0

#minimize		0.000001 0.000001 10000 10000
#velocity        all create 300.0 497 dist gaussian

reset_timestep 0

velocity all scale 300.0

timestep           0.01

fix 2 all nve

compute vacf all vacf
fix 3 all ave/time 10 10 100 c_vacf[*] file vacf.dat

thermo	           10
thermo_style       custom step cpu temp pe ke epair ecoul  etotal density lx ly lz
dump		   1 all custom 5 dump.xyz id type x y z vx vy vz
dump_modify	   1 sort id

run 		   20000
Could anybody please assist in what could get wrong for getting this result?
I am very sorry if this question is not quite relevant to this forum. But I will really appreciate any thoughts on this.
Thank you very much for your assistance, in advance.
The velocity autocorrelation function is usually dominated by an exponential decay signal (in the time domain). This makes sense – particles’ velocities do not instantaneously change randomly; seeing a velocity at time t gives you information about its velocity a short time later, with that information’s validity decaying over time.
The Fourier transform of a signal with non-zero mean will have a non-zero peak at frequency zero.
I do not remember enough physics offhand to tell you how to interpret this peak, but it is mathematically expected and correct.
Dear @srtee thank you very much for your response.
Does this mean that I must equilibrate the system for longer times before running NVE for VACF analysis? Or this trend is normal? Because I have checked many papers in the literature and almost all plots have a zero value at zero frequency.
I’m worried that your post shows a foundational misunderstanding of the velocity autocorrelation function.
Let’s say that in your simulation a particle is moving at time 0 with the velocity 0.1 angstrom/femtosecond in the x-direction.
One timestep later, the velocity will be almost exactly the same. Let’s say it’s (0.0999, 0.002, -0.004) instead of (0.1000, 0.0, 0.0).
A hundred timesteps later, the velocity should still be quite similar but have changed somewhat – let’s say (0.070, 0.010, -0.040).
By ten thousand timesteps the velocity would be quite different.
This is what I mean by “an exponential velocity autocorrelation function” – it will be 1 at time 0, 0.9 at a hundred timesteps, … The area under that curve will generally not be zero. Therefore, the Fourier transform of the VACF will generally not be zero at zero velocity.
I hope you can see that this has nothing to do with equilibration, NVE vs NVT integrators … this is a fundamental property of microscopic thermal motion.
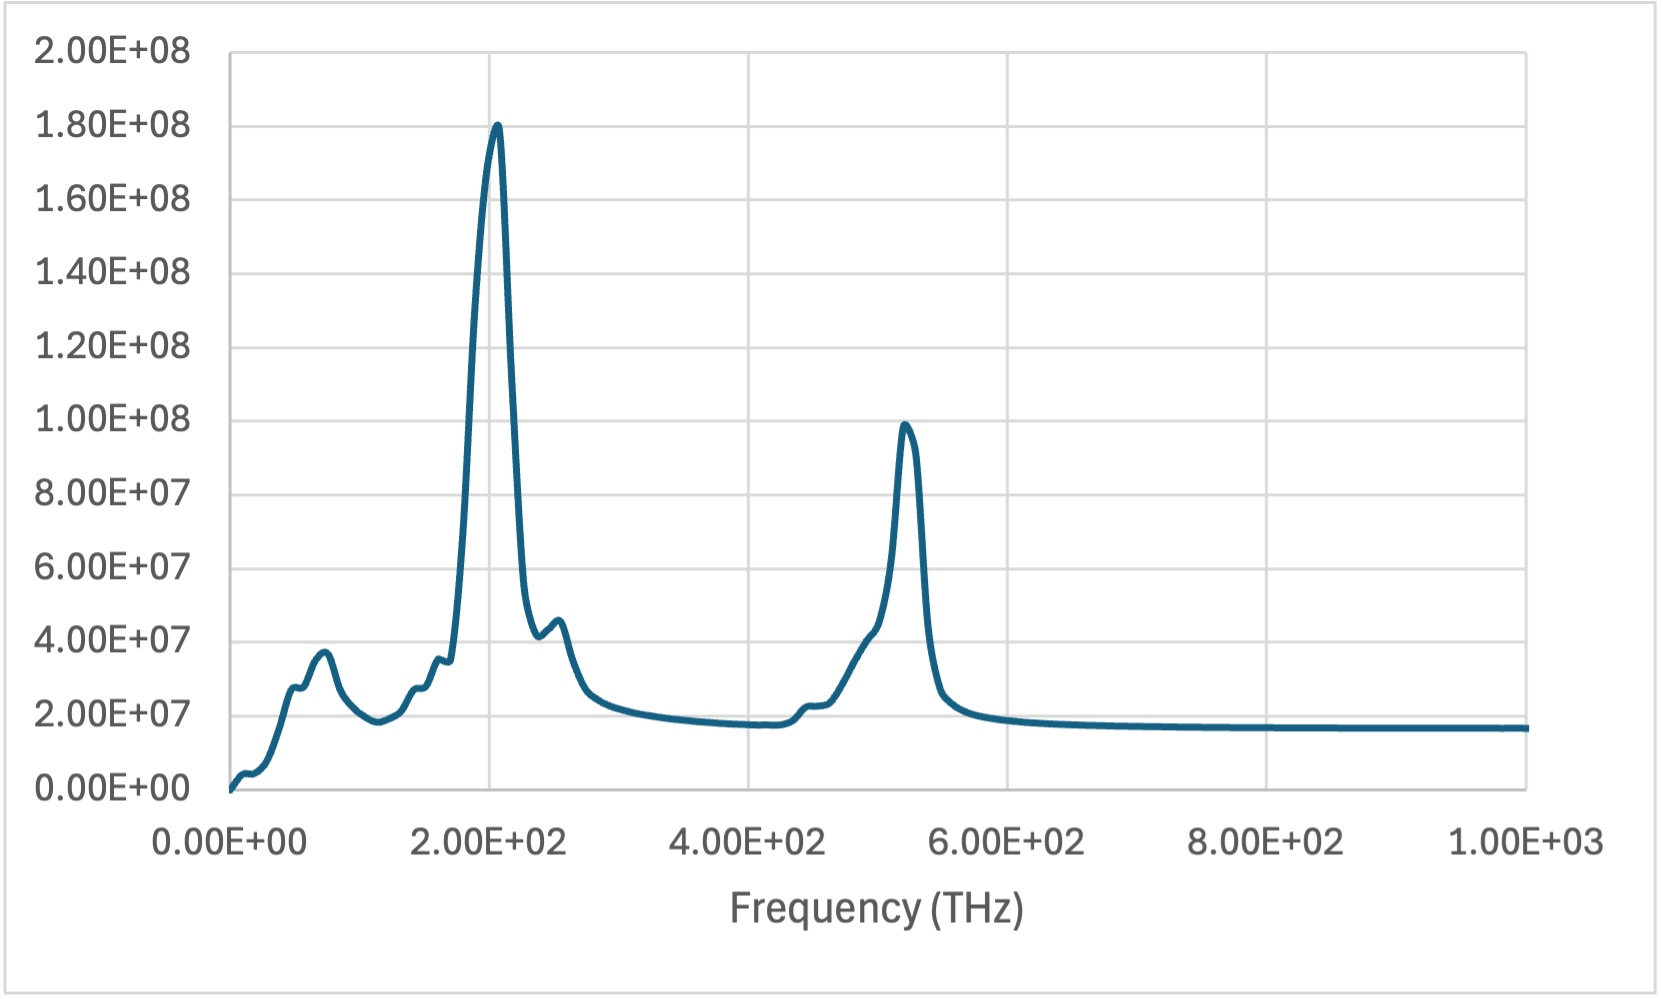
This means that the papers you cite perform some additional transformation after the Fourier transform. From my offhand memory the FT is multiplied by frequency squared to get the VDOS – that would give zero at zero frequency. For best results, look at these papers you are looking at and search for a formula that shows you exactly what calculations to do.
Thank you very much for your informative response. I took your advice and checked some procedures to remove the peak at the zero frequency. However, my other concern is about the frequency value itself. From my analysis, the frequency at which peaks happen, is in the high frequency ranges (in the order of 100 to 200 THz). However, I should be able to see some vibrations in the smaller frequencies, corresponding to the acoustic movements. I was wondering if this could be related to the time steps of my simulation or not? I have actually tried different time steps, but they seem not to be capturing the small frequency vibrations. Is there any considerations that I need to take in mind?
I sincerely appreciate your guidance on this matter.
Bests,