I am trying to calculate the dynamic structure factors for my systems using the dynasor library (version 1.2). I did not get the results I am looking for so I decided to try one of the examples on aluminum liquid. Using the same LAMMPS script and the python code used in the example, the results of the calculated heatmaps S and C do not match with the ones from the examples. Did anyone encounter such differences?
Hi,
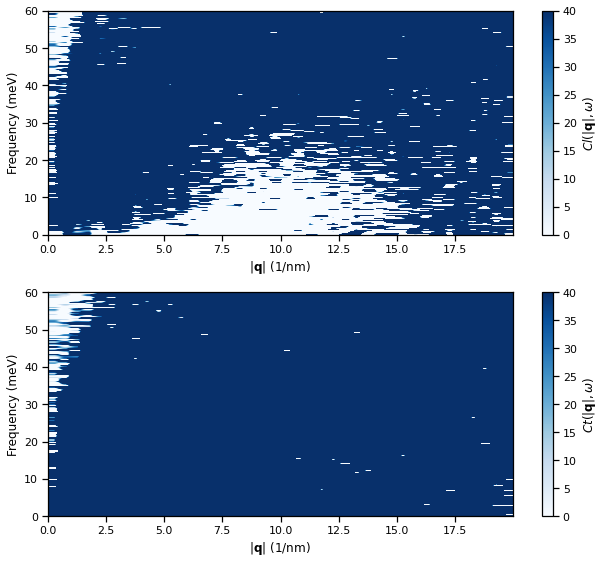
To what extend does your results not match the examples? Could you post some figures?
Some deviations are expected due to statistical noise etc.
But if results are very different maybe something went wrong with your lammps simulation, does the trajectory look reasonable?
You can also compare with the new notebook example for liquid Aluminium (with newer version of dynasor) here.
Yes you are correct, in the new master version of dynasor we switched units from nm → Å.
Meaning you need to set q_max = 2.0 (not 20.0) to get the correct behaviour.
Furthermore for the velocity correlation will have a different heatmap scale (10^2 times large values), so changeing the clim from [0, 40], to [0, 4000] should produce the same behaviour.
I will update the notebook in dynasor master asap.