Dear everyone, I have a question that I would like to consult. When I use the fix npt 600.0 600.0 100 * dt iso 500.0 30.0 1000 * dt command, the volume and time graph of the process show a trend of first decreasing and then increasing. I don’t quite understand why this trend occurs, how can I explain it?
How could we know? There is no idea what your system is and so on…
I’m sorry, I’m using an instance provided in the moltemplate, oplsaa hexadecane. I have made some modifications to the temperature and pressure, and I have not made any changes to anything else except for the temperature and pressure adjustments provided in the hexadecane example.I changed its temperature from 900 to 1200, the pressure from 1.0 to 30.0, and nothing else was changed.
run.in.npt (3.6 KB)
But these are significant changes. Wait for some time until your system stabilizes.
Yes, it is indeed a significant change. I just don’t quite understand why this situation happened. Don’t I need to overly focus on it? Do we just need to increase the simulation time?
It seems to me like you made an abrupt change of conditions and I would expect that you pushed the system far from equilibrium. I would try to change conditions more gradually or in discrete steps. It would be more controllable.
I don’t quite understand what you mean. Is it because I caused a sudden change in temperature or pressure in the NPT to be too large? For example, if the temperature changes from 1200 to 1000, 1000 to 800, and finally reaches the desired temperature, is the pressure the same?
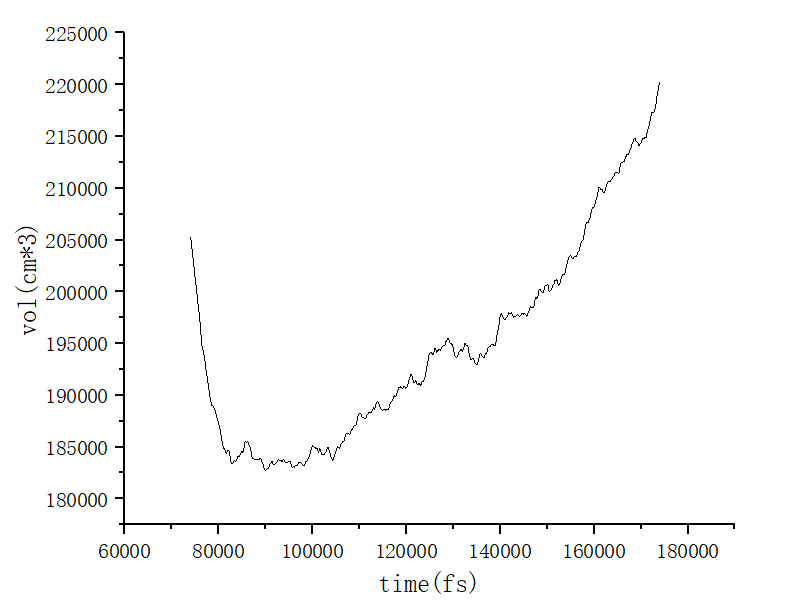
I am not sure if you’ve missed the temp keyword, but if you have, then this looks like a system that you have barostatted at 500.0 atm at the simulation start and 30.0 atm at the simulation end.
Your volume graph reads like your system initially undergoes rapid compression, as it should under an initial pressure of 500.0 atm, and then slowly expands, as it would if the pressure were being gradually reduced to 30.0 atm.
I am not sure what exactly you are worried about given those results.
I’m sorry, I did forget to include the temp keyword. The change you mentioned due to the pressure dropping from 500 to 30 is normal, but when I use fix npt all npt temp 1200 600 100 * dt iso 500 500 1000 * dt, the image of volume and time does show a trend of first increasing and then decreasing. Why is this happening?
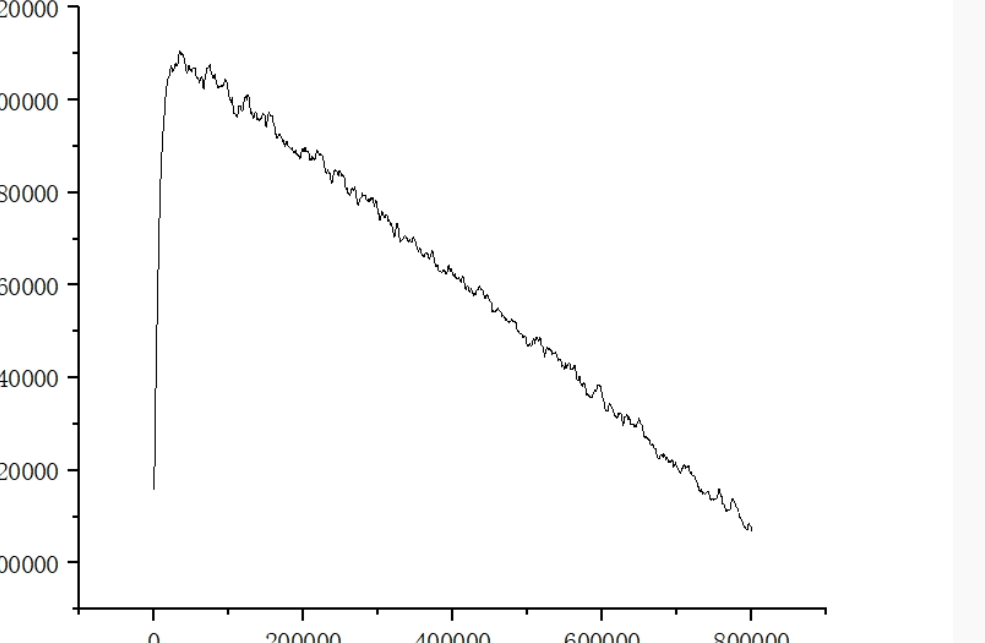
Well, under constant pressure, wouldn’t your material occupy more volume at 1200K and contract as the temperature decreases?
My understanding is that a decrease in temperature leads to less intense molecular movement, resulting in a decrease in volume. I am not sure if this understanding is correct, but I have not quite understood that the volume kept increasing at the beginning.
If your material is instantaneously heated to 1200K, after being initially prepared at an equilibrium density suited to a much lower temperature, what should happen?