Hello All,
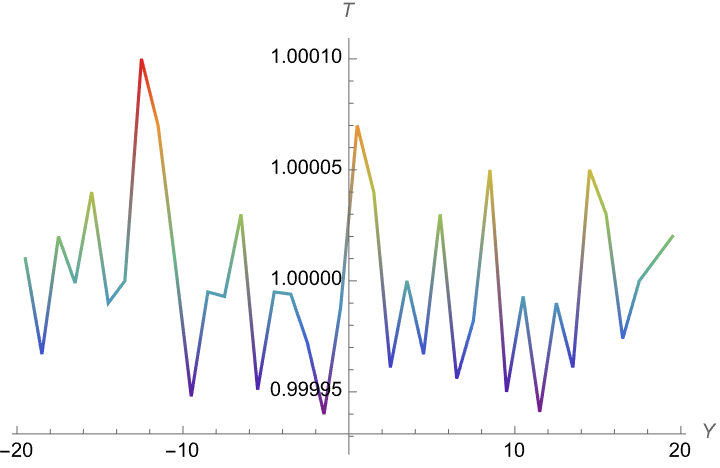
I created a box, in which I have beads type 1 in the left (of y direction) and beads type 2 in the right. I have a heat source on the middle of the right side and a heat sink in the middle of the left region. I am expecting that if I choose thermal conductivity (in the pair_coeff) between region 1 & 2 way smaller that each region’s thermal conductivity, I should see a jump in temperature graph (heat should not conduct between two regions). But what I observe is that on both cases of
K11=k22=k12= 1.5E10^-5 & k11=k22=1.5E10^-5, K12=10^-10
I get the same temperature graph. (beads type1 & beads type2 remain in their region (fix rigid)). Not jump appears in the case of k11=k22=1.5E10^-5, K12=10^-10
Could you please help me understand why I am getting the same graph for both case? Is there anything I am doing wrong?
Here is my code:
units lj
dimension 3
boundary p p p
neighbor 0.2 bin
neigh_modify every 1 delay 0 check yes
atom_style edpd
region edpd block -20 20 -20 20 -10 10 units box
region edpd1 block -20 0 -20 20 -10 10 units box
region edpd2 block 0 20 -20 20 -10 10 units box
create_box 2 edpd #2 is number of atom types
create_atoms 1 random 16000 276439 edpd1
create_atoms 2 random 16000 276438 edpd2
group edpd1 region edpd1
group edpd2 region edpd2
mass 1 1.0
mass 2 1.0
set atom * edpd/temp 1.0
set atom * edpd/cv 1.5E5
pair_style edpd 1.58 9872598
pair_coeff 1 1 18.75 4.5 0.41 1.58 1.45E-5 2.0 1.58
pair_coeff 2 2 18.75 4.5 0.41 1.58 1.45E-5 2.0 1.58
pair_coeff 1 2 18.75 4.5 0.41 1.58 1.45E-10 2.0 1.58
compute mythermo all temp
thermo 100
thermo_modify temp mythermo
thermo_modify flush yes
comm_modify vel yes
velocity all create 1.0 432982 loop local dist gaussian
fix rigid all rigid single
fix mvv all mvv/edpd 0.5
fix upper edpd1 edpd/source cuboid 0 10 0 40 10 20 0.01
fix lower edpd2 edpd/source cuboid 0 -10 0 40 10 20 -0.01
timestep 0.01
run 1000
reset_timestep 0
compute temp all edpd/temp/atom
compute ccT all chunk/atom bin/1d y 0.0 1.0
fix stat all ave/chunk 1 1000 1000 ccT c_temp density/number norm sample file tempK10.profile
run 1000
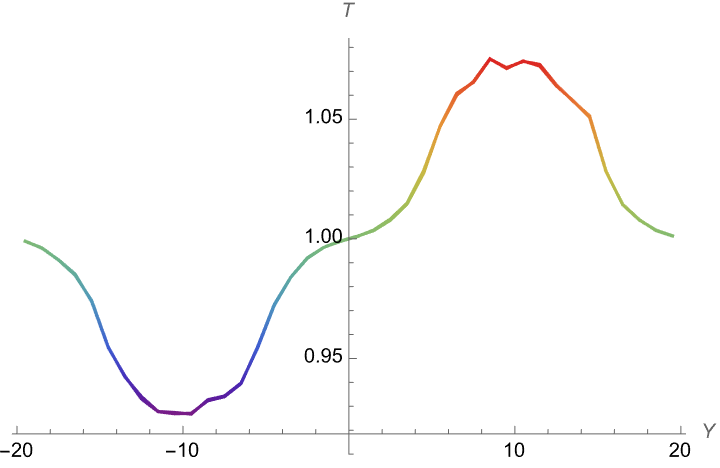
I just noticed that I am choosing the left region in x direction and right region the positive x derection. I changed my box so that I have two separated region in y direction instead.
region edpd block -20 20 -20 20 -10 10 units box
region edpd1 block -20 20 -20 0 -10 10 units box
region edpd2 block -20 20 0 20 -10 10 units box
but the answer I get for temperature does not make sense at all: