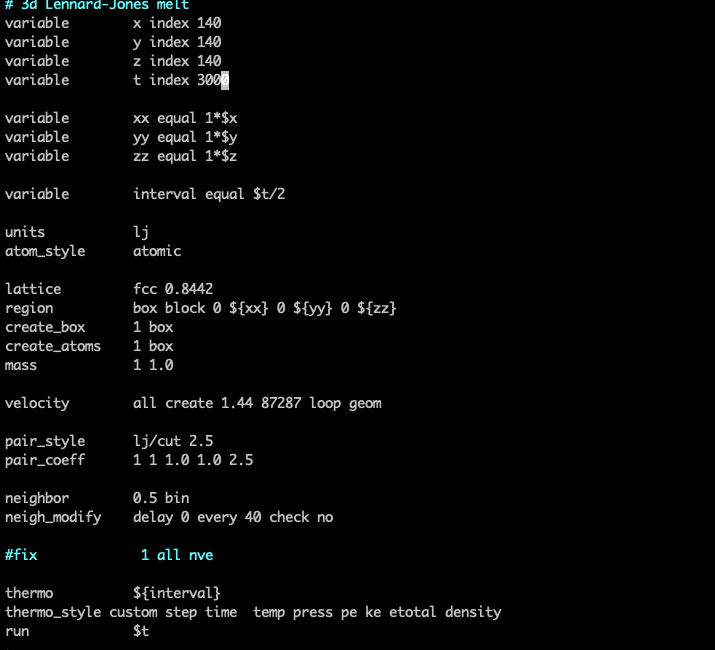
I have run a lammps simjulation.
The outupt is very strange.
Device Time Info (average):
Data Transfer: 126.2653 s.
Neighbor copy: 0.3334 s.
Neighbor build: 6.2128 s.
Force calc: 38.1705 s.
Device Overhead: 0.0872 s.
Average split: 1.0000.
Lanes / atom: 4.
Vector width: 32.
Max Mem / Proc: 9171.50 MB.
CPU Neighbor: 7.9423 s.
CPU Cast/Pack: 317.7448 s.
CPU Driver_Time: 0.0701 s.
CPU Idle_Time: 143.1766 s.
Total wall time: 0:11:10
The CPU cast and pack took almost half of the time.
There is lots of important information missing here:
what is your LAMMPS version?
what is your GPU hardware?
and what kind of machine and operating system are you running on?
did you compile LAMMPS yourself or used a pre-compiled binary and if the former, how did you configure and compile the GPU package support? Specifically, what precision mode (mixed/double/single) and what computation mode (CUDA/OpenCL/HIP)?
are you using the machine exclusively or are you sharing it with other users?
Your system is very large (too large for my desktop machines). So it is difficult to compare. I can fit a more modest 4 M atom system on a desktop machine with a passively cooled mobile GeForce GTX 1060 6GB, 10 CUs, 5.4/5.9 GB, 1.7 GHZ running “lmp -in bench/in.lj -v x 5 -v y 5 -v z 5 -sf gpu” and I get for the 100 steps
Device Time Info (average):
Data Transfer: 1.5381 s.
Neighbor copy: 0.0100 s.
Neighbor build: 0.2727 s.
Force calc: 3.2486 s.
Device Overhead: 0.0069 s.
Average split: 1.0000.
Lanes / atom: 4.
Vector width: 32.
Max Mem / Proc: 3352.00 MB.
CPU Neighbor: 0.2145 s.
CPU Cast/Pack: 2.0326 s.
CPU Driver_Time: 0.0069 s.
CPU Idle_Time: 0.0006 s.
Total wall time: 0:00:13
I don’t have a very powerful GPU, but with a less than 3x larger system, your GPU time is over 10x larger. Can it be that you are sharing the GPU with other processes?
Also, your CPU time seems to be a lot larger than what would be expected for the system size and a reasonably modern CPU (mine is on the old side yet proportionally 6x faster). So that would hint at an overloaded CPU as well.
I think the problem is the installation problem. The available threads are not actually used.
But I didn’t find a make command or -D flags to enable this.
This is a very imprecise description (and thus very unscientific) the LAMMPS version is a date and always printed at the beginning of an output. What is “the latest” depends a lot on who you ask and how they installed LAMMPS.
I disagree on this. Your obsession with unused threads signals that you have very little understanding of how performance in LAMMPS is achieved. There is a detailed discussion of various options and their benefits and shortcomings in the manual: https://docs.lammps.org/Speed.html
Yes, you can compile LAMMPS with OpenMP enabled and also install the OPENMP package with multi-threaded versions of a lot of pair styles. But there is no point in using both OpenMP and GPU for GPU acceleration. The transfer of data from host to GPU is limited by the physical bandwidth of the device and cannot be accelerated with multi-threading. On the contrary. Your timings are very bad which indicate some issue with your machine or how you use it or that you are not using it exclusively.
If data transfer between host and GPU is so much penalized, you may be better off using the KOKKOS package instead of the GPU package. For extremely large particle counts and when using compatible fixes for time integration and otherwise, that is generally faster as it avoids most of the data transfer between host and GPU. The GPU package is better for small particle counts and when only part of the calculation styles and features are GPU accelerated, so LAMMPS can run those different parts concurrently on GPU and CPU.
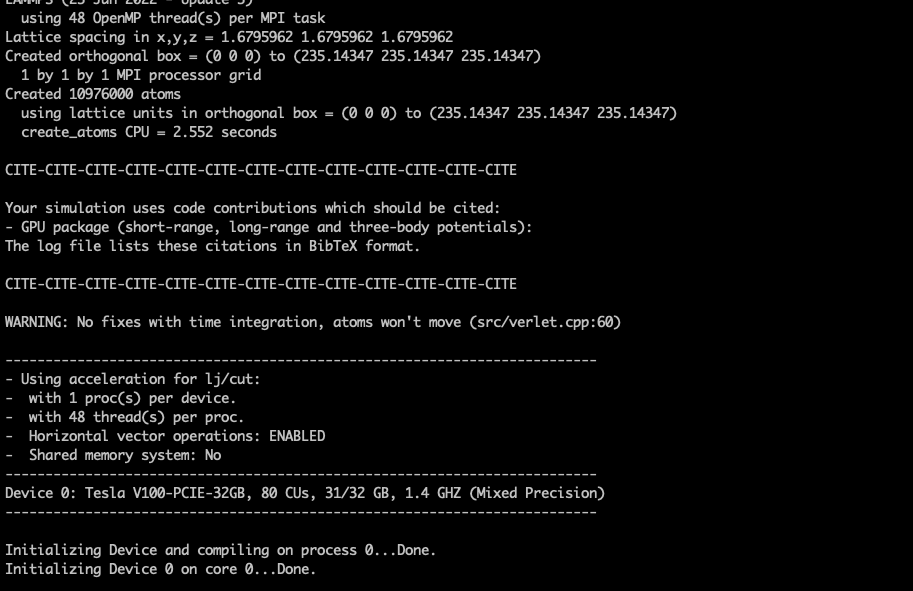
I found an empty slot on our local GPU server with Tesla V100 GPUs and here is what I get for running “lmp -in bench/in.lj -v x 7 -v y 7 -v z 7 -sf gpu” with the latest version of LAMMPS, one GPU and just one OpenMP thread. As you can easily see, the numbers are very different. For an LJ potential with a rather short cutoff of 2.5 sigma in reduced units, there is not much time spent on computation.
--------------------------------------------------------------------------
- Using acceleration for lj/cut:
-  with 1 proc(s) per device.
-  Horizontal vector operations: ENABLED
-  Shared memory system: No
--------------------------------------------------------------------------
Device 0: Tesla V100-SXM2-16GB, 80 CUs, 15/16 GB, 1.5 GHZ (Mixed Precision)
--------------------------------------------------------------------------

Initializing Device and compiling on process 0...Done.
Initializing Device 0 on core 0...Done.
[...]
---------------------------------------------------------------------
      Device Time Info (average):
---------------------------------------------------------------------
Data Transfer:   4.3128 s.
Neighbor copy:   0.0254 s.
Neighbor build:  0.3047 s.
Force calc:      0.9420 s.
Device Overhead: 0.0035 s.
Average split:   1.0000.
Lanes / atom:    4.
Vector width:    32.
Max Mem / Proc:  9167.80 MB.
CPU Neighbor:    0.7717 s.
CPU Cast/Pack:   8.8397 s.
CPU Driver_Time: 0.0017 s.
CPU Idle_Time:   4.6187 s.
---------------------------------------------------------------------

Total wall time: 0:00:43
The issue must be with your machine, either its bus system or the general architecture or that the machine is overloaded.
To quantify this. With the LAMMPS version 8 Feb 2023 and the GPU package compiled for CUDA and mixed precision with GCUDA 11.6 on a single Tesla V100 w 16GB with a single CPU and thread, I can run about 6 times faster (2000 timesteps instead of 300 in 11 minutes). Usually with the same GPU you may see 20-30% variation in performance depending on the host configuration. This is on a machine running Ubuntu 18.04LTS with Intel(R) Xeon(R) CPU E5-2620 v4 @ 2.10GHz CPU and 512GB RAM.
Data Transfer: 4.3128 s.
Neighbor copy: 0.0254 s.
Neighbor build: 0.3047 s.
Force calc: 0.9420 s.
Device Overhead: 0.0035 s.
Average split: 1.0000.
Lanes / atom: 4.
Vector width: 32.
Max Mem / Proc: 9167.80 MB.
CPU Neighbor: 0.7717 s.
CPU Cast/Pack: 8.8397 s.
CPU Driver_Time: 0.0017 s.
CPU Idle_Time: 4.6187 s.
Here you can see that CPU spends most of the time in Cast/Pack.
I looked into this part. For cast, the main for loop here is
It is next to pointless to multi-thread these kind of data copying operations that do not include computation. Those are almost entirely memory bandwidth bound and by multi-threading (especially with a very large number of threads) you can run into additional performance problems because of “false sharing” and that the different threads will mutually invalidate caches when the cache lines overlap.
if the data transfer rates bother you, don’t use the GPU package, use KOKKOS. For as large a system on a single GPU that is the faster option (note: KOKKOS currently only supports double precision).
if you are memory bandwidth limited, multi-threading does not provide much of a speedup
you don’t provide enough information to make any assessment why you are not seeing threading in use. I do and at best I see a few % speedup from a moderate number of threads and a slowdown if too many threads are used
the numbers you posted suggest that you are using a server where you are sharing the CPU and GPU with others, so those numbers are not representative
the LJ potential has very little computational work. It can utilize a V100 GPU only to about 10% on average. You should compare to a potential that has more work to do on the GPU, like the EAM benchmark example. Then the ratio between data transfer would be a much smaller fraction of the total time.