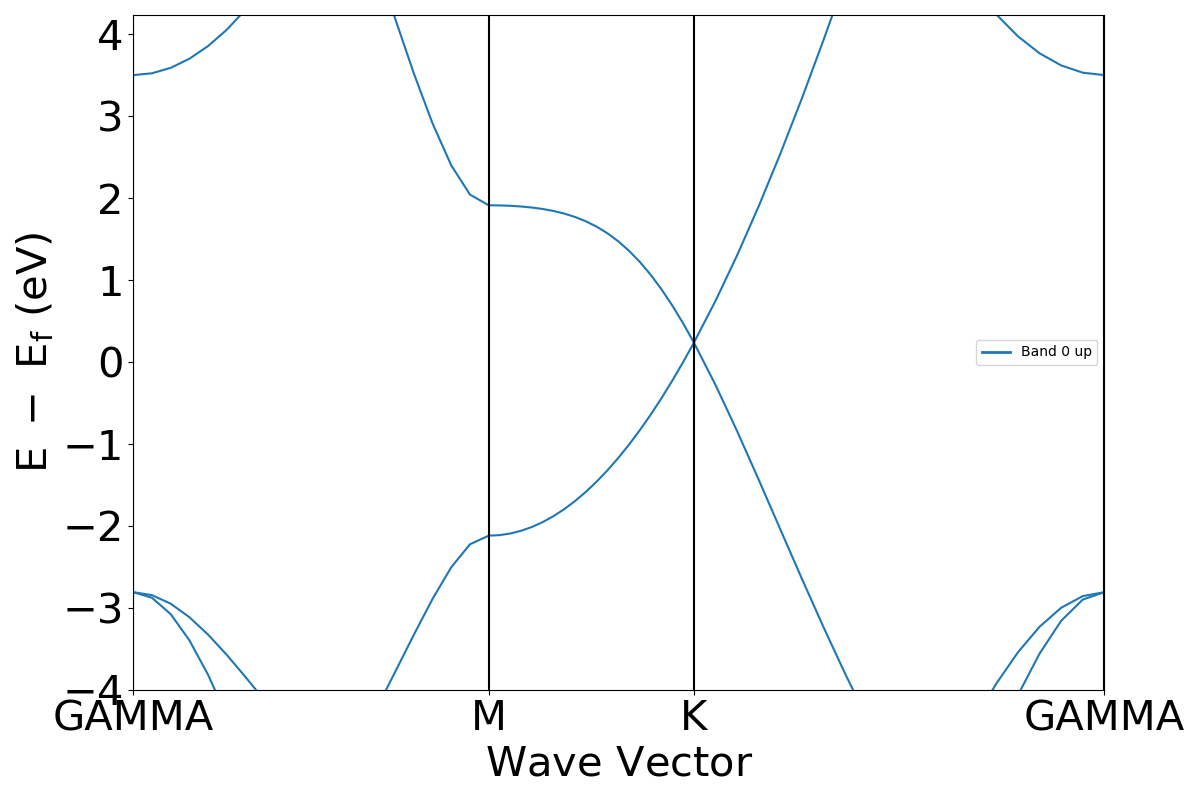
Hi, I’m trying to extract information about the bandstrcuture of graphene from vasp outputs. However, pymatgen gives a wrong bandgap and a correct bandstructure plot. Is there any way to fix the problem?
vaspfiles.zip (96.7 KB)
from pymatgen.electronic_structure.plotter import BSPlotter
from pymatgen.io.vasp.outputs import Vasprun

vasprun = Vasprun('vasprun.xml',parse_projected_eigen=False)
bs_data = vasprun.get_band_structure(line_mode=True)

print('bandgap:',bs_data.get_band_gap())
print('is_metal:',bs_data.is_metal())

bs_plotter = BSPlotter(bs_data)
#bs_plotter.get_plot()
bs_plotter.save_plot(filename='band.png',img_format='png')