Hi everyone,
I wanted to share a small post-processing workflow for researchers who need to prepare reaction energy or free-energy profile figures from DFT, NEB, or other atomistic simulation results.
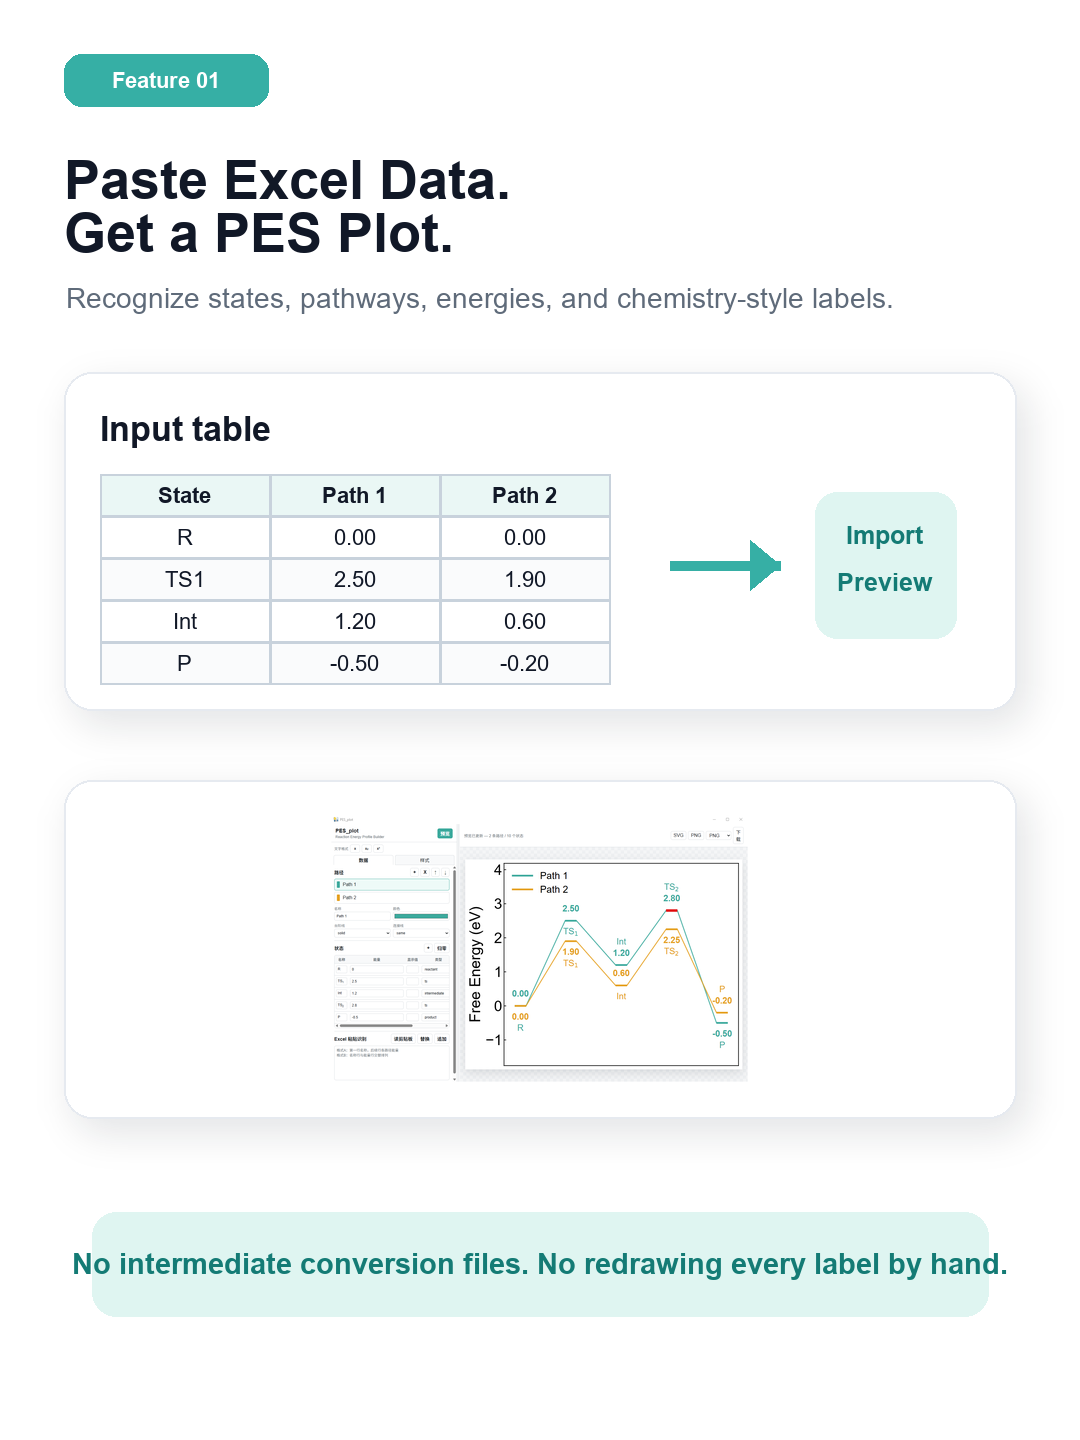
After the calculation step, I usually find it helpful to put the energies into a simple spreadsheet table:
| State | Pathway A | Pathway B |
|---|---|---|
| Reactant | 0.00 | 0.00 |
| TS1 | 12.4 | 10.8 |
| Intermediate | 4.1 | 3.5 |
| Product | -2.0 | -1.6 |
Then all pathways can be shifted to the same reference state, usually the initial reactant at 0. This avoids mixing large absolute total energies with the relative barriers and reaction energies that are usually shown in mechanism figures.
I built a small Windows desktop tool, PES Plot, for this final figure-making step. It is designed for reaction energy profiles and energy step diagrams rather than general plotting.
Main features:
- paste Excel-style tables directly;
- automatically parse state labels and energy values;
- zero-reference a pathway to the initial state;
- draw one or multiple pathways;
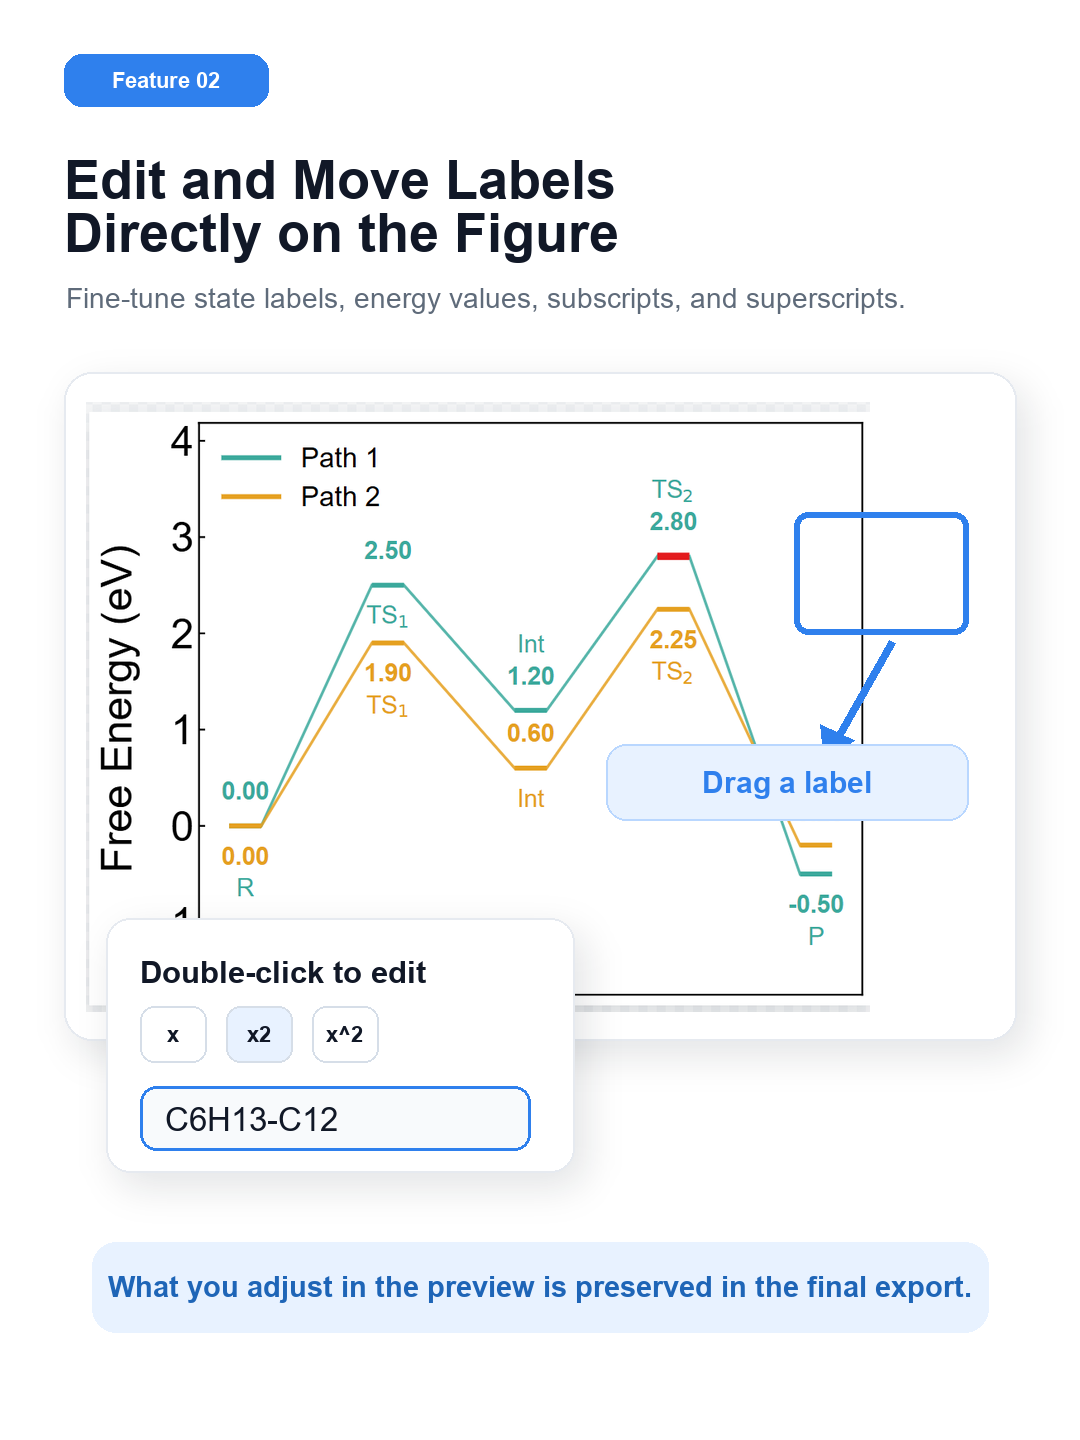
- edit labels and energies in the side panel or directly in the preview;
- drag labels to fine-tune their positions;
- format chemical labels with subscript/superscript text;
- draw solid, dashed, or S-shaped dashed step connections;
- export PNG, SVG, PDF, TIFF, and EPS.
It does not perform DFT, NEB, transition-state searches, or quantum-chemistry calculations. It only handles the downstream figure preparation after the energies are already available.