Hello OVITO Team,
I hope you are doing well.
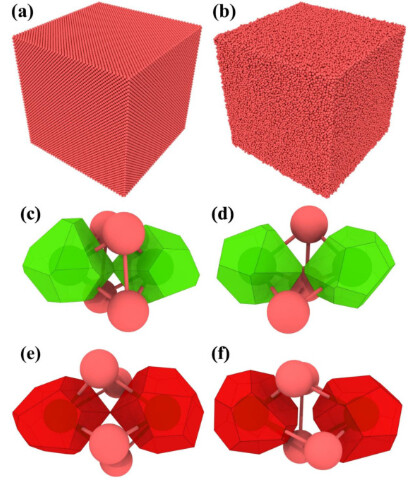
I would like to reproduce the types of visualizations shown in the attached figures using OVITO .
Specifically, I am interested in extractin g:
-
The coordination polyhedra around selected atoms (similar to Figures (c)–(f )).
-
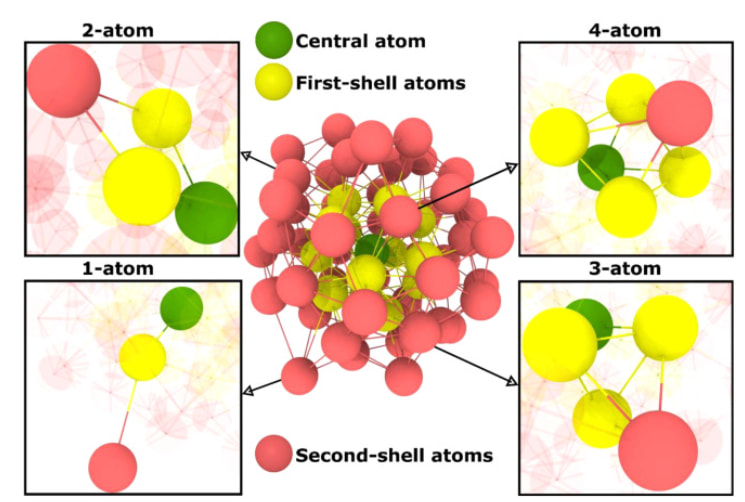
The central atom, first-shell atoms, and second-shell atoms with different col ors.
-
The different cluster connection types (1-atom, 2-atom, 3-atom, and 4-atom connections), as illustrated in the second fi gure.
-
A visualization similar to these published figures, where only the relevant atoms and their coordination polyhedra are disp layed.
However, I do not know how to generate the visualizations shown in the attached f igures.
Could you please advise:
-
Is it possible to create these figures directly i n OVITO?
-
Which modifiers should be used?
-
Is a Python script required, or can this be done through the graphical interface?
-
If possible, could you provide an example workflow or script?
Thank you very much for your time and assistance.
Best regards,